AAPL 172.69 -2.1863% MSFT 413.64 -1.9578% GOOG 156.33 -1.7966% GOOGL 154.86 -1.8196% AMZN 183.0 -1.6816% NVDA 860.01 -2.4777% META 500.23 -2.2797% TSLA 161.48 -5.5949% TSM 140.14 -1.6699% LLY 750.77 -0.1157% V 271.28 -1.6959% AVGO 1310.69 -2.4835% JPM 182.89 0.0547% UNH 445.63 1.464% NVO 123.9 -0.4899% WMT 59.93 -0.3492% LVMUY 167.15 1.0519% XOM 119.65 -0.5982% LVMHF 841.75 1.379% MA 459.79 -1.2012%

Section 1: Company Overview and Fundamentals
1.1 Company Overview:
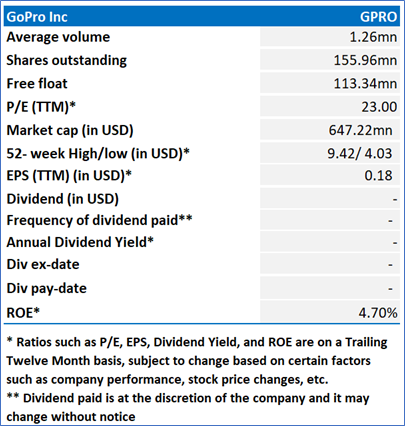
GoPro, Inc. produces cameras, and mountable and wearable accessories. The Company offers a family of cameras, including its cloud connected HERO10 Black, HERO9 Black, HERO8 Black and MAX cameras. Its HERO10 Black camera offers 5,300 pixels (5.3K) video at 60 frames per second, HERO9 Black camera offers 5K video at 30 frames per second, and HERO8 Black camera can shoot video in 4K at 60 frames per second.
Kalkine’s Diversified Opportunities Report covers the Company Overview, Key positives & negatives, Investment summary, Key investment metrics, Top 10 shareholding, Business updates and insights into company recent financial results, Key Risks & Outlook, Price performance and technical summary, Target Price, and Recommendation on the stock.
Stock Performance:
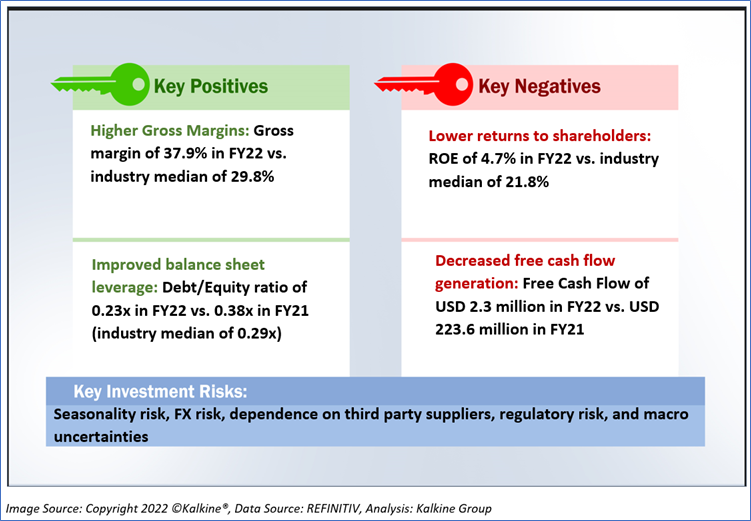
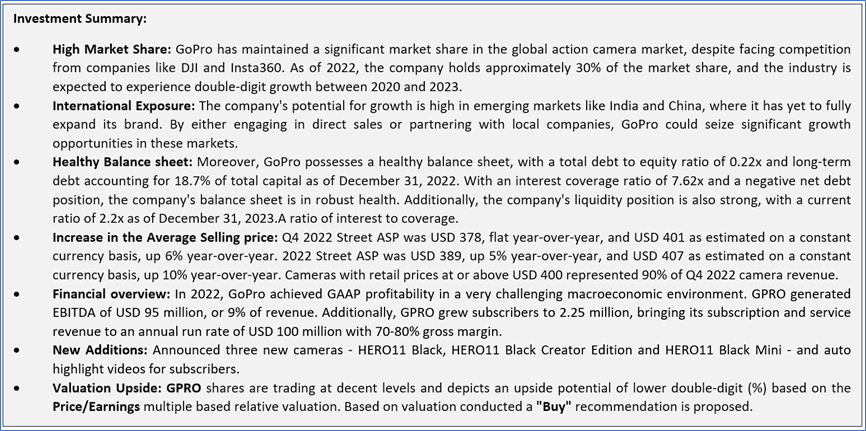
1.2 The Key Positives, Negatives, and Investment summary
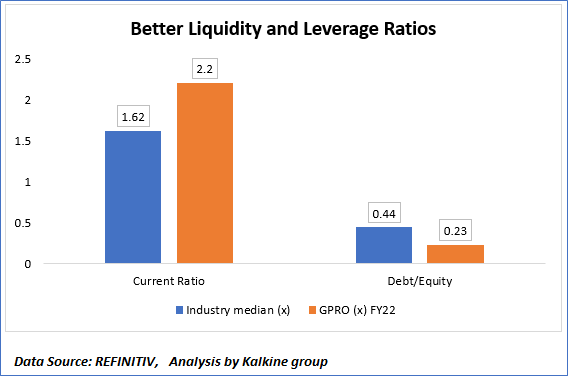
1.3 Key Metrics:
The graph below demonstrates GPRO has superior short-term liquidity to its competitors and a smaller debt-to-equity ratio, which indicates lesser balance sheet risk.
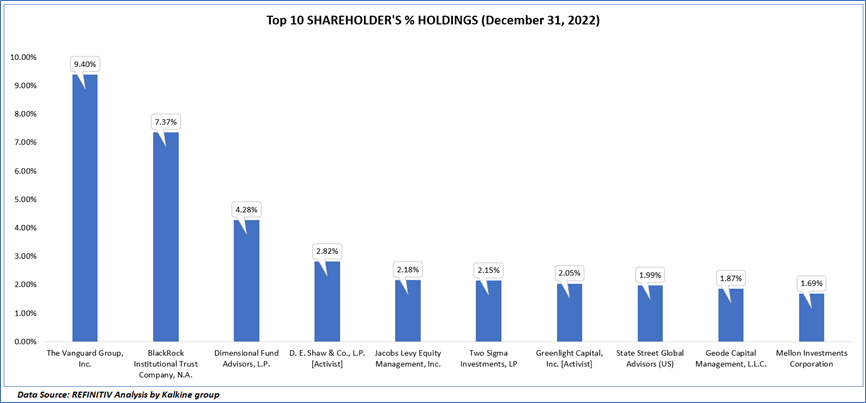
1.4 Top 10 shareholders:
The top 10 shareholders together form ~35.80% of the total shareholding, signifying diverse shareholding. The Vanguard Group, Inc, and BlackRock Institutional Trust Company, N.A. are the biggest shareholders, holding the maximum stake in the company at ~9.40% and ~7.37%, respectively.
Section 2: Business Updates and Corporate Business Highlights
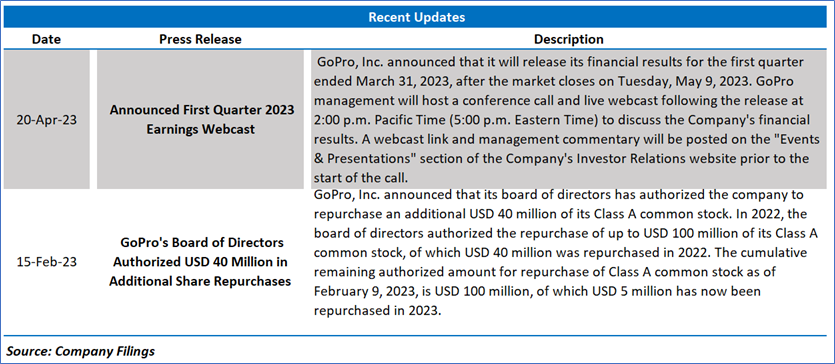
2.1 Recent Updates:
The below picture gives an overview of the recent updates:
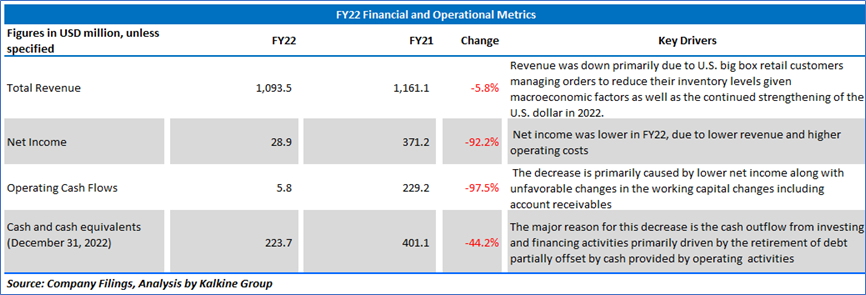
2.2 Insights of FY22:
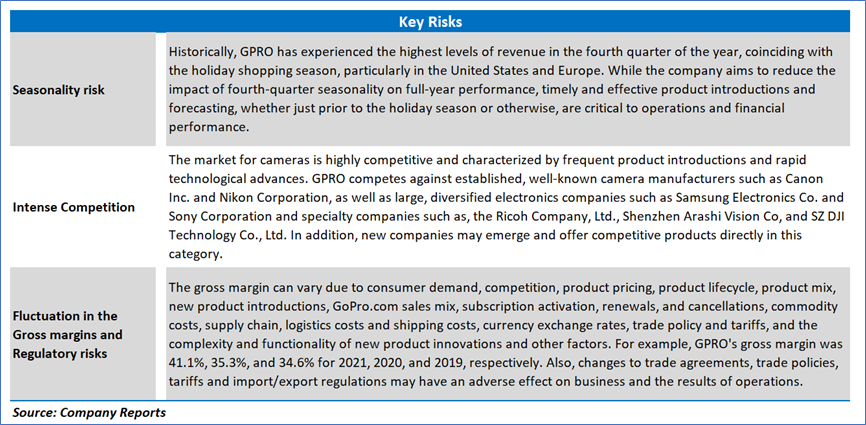
Section 3: Key Risks
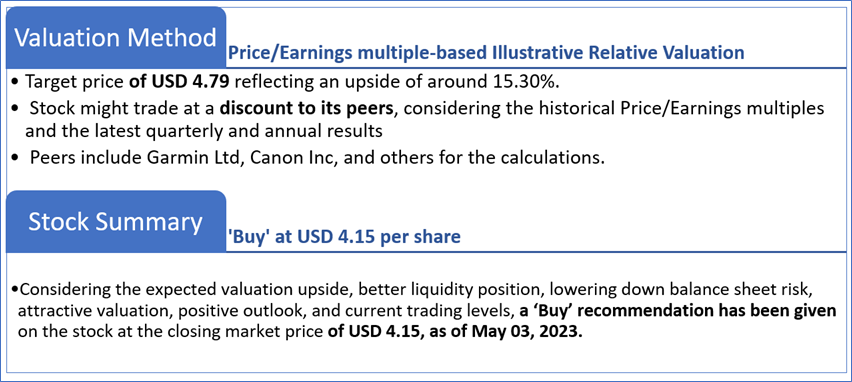
Section 4: Stock Recommendation Summary:
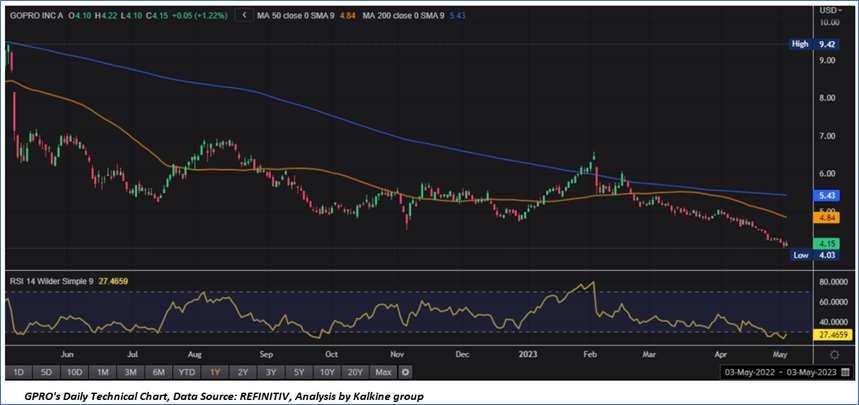
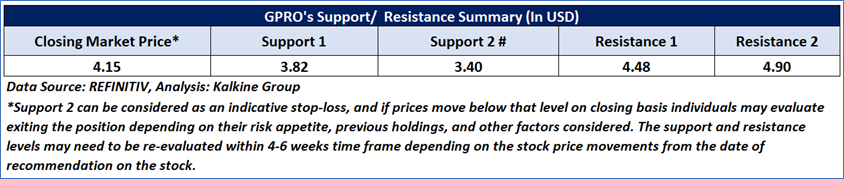
4.1 Price Performance and Technical Summary:
Stock Performance:
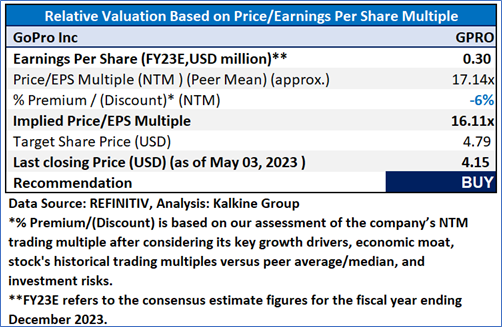
4.2 Fundamental Valuation
Valuation Methodology: Price/Earnings per share Multiple Based Relative Valuation
Markets are trading in a highly volatile zone currently due to certain macroeconomic issues and geopolitical tensions prevailing. Therefore, it is prudent to follow a cautious approach while investing.
Note 1: Past performance is not a reliable indicator of future performance.
Note 2: The reference date for all price data, currency, technical indicators, support, and resistance levels is May 03, 2023. The reference data in this report has been partly sourced from REFINITIV.
Note 3: Investment decisions should be made depending on an individual's appetite for upside potential, risks, holding duration, and any previous holdings. An 'Exit' from the stock can be considered if the Target Price mentioned as per the Valuation and or the technical levels provided has been achieved and is subject to the factors discussed above.
Note 4: The report publishing date is as per the Pacific Time Zone.
Technical Indicators Defined: -
Support: A level at which the stock prices tend to find support if they are falling, and a downtrend may take a pause backed by demand or buying interest. Support 1 refers to the nearby support level for the stock and if the price breaches the level, then Support 2 may act as the crucial support level for the stock.
Resistance: A level at which the stock prices tend to find resistance when they are rising, and an uptrend may take a pause due to profit booking or selling interest. Resistance 1 refers to the nearby resistance level for the stock and if the price surpasses the level, then Resistance 2 may act as the crucial resistance level for the stock.
Stop-loss: It is a level to protect against further losses in case of unfavorable movement in the stock prices.
Kalkine Equities LLC provides general information about companies and their securities. The information contained in the reports, including any recommendations regarding the value of or transactions in any securities, does not take into account any of your investment objectives, financial situation or needs. Kalkine Equities LLC is not registered as an investment adviser in the U.S. with either the federal or state government. Before you make a decision about whether to invest in any securities, you should take into account your own objectives, financial situation and needs and seek independent financial advice. All information in our reports represents our views as at the date of publication and may change without notice.
Kalkine Media LLC, an affiliate of Kalkine Equities LLC, may have received, or be entitled to receive, financial consideration in connection with providing information about certain entity(s) covered on its website.
 US
US  AU
AU UK
UK CA
CA NZ
NZ Please wait processing your request...