AAPL 189.82 -0.0105% MSFT 420.21 -0.1853% GOOG 177.29 1.0603% GOOGL 176.13 1.1195% AMZN 184.7 0.5827% NVDA 924.79 -1.9924% META 472.8 -0.0909% TSLA 177.46 1.4985% TSM 151.68 -0.3613% LLY 770.0 -0.1452% V 280.11 0.0965% AVGO 1395.29 -1.1925% JPM 204.85 1.1755% UNH 524.63 0.6446% NVO 131.89 -0.8644% WMT 64.65 0.9998% LVMUY 170.44 0.0881% XOM 119.67 1.5271% LVMHF 854.13 0.3013% MA 460.27 0.3051%
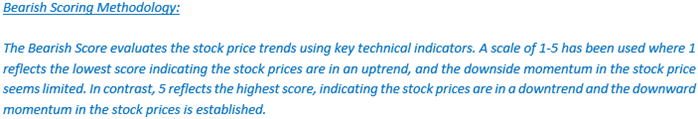
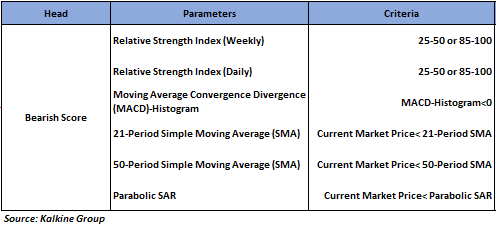
Company Overview: Kiniksa Pharmaceuticals, Ltd. (NASDAQ: KNSA) is a biopharmaceutical company focused on discovering, acquiring, developing, and commercializing therapeutic medicines for patients suffering from debilitating diseases. This Report covers the Price Action, Technical Indicators Analysis along with the Support Levels, Resistance Level, and Trend Indication on this one stock. Noted below is the illustrative bearish score based on technical indicators for the stock:


Technical Observation (on the Daily Chart)
KNSA’s prices recently broke an upward sloping trend line by the downside and are sustaining below the breakout level, indicating the possibility of further downward momentum hereon. The trend line breakout in the stock is accompanied by increased volumes, further supporting a negative bias.


Conclusion

Based on the above-mentioned price action and technical indicators analysis, Kiniksa Pharmaceuticals, Ltd. may witness a downside movement in the near future. The trend looks to be in an interesting space, and the stock looks ‘Bearish’ at the close price of USD 15.53 as on October 03, 2023.
Markets are trading in a highly volatile zone currently due to certain macro-economic issues and prevailing geopolitical tensions. Therefore, it is prudent to follow a cautious approach while making investment decisions.
Note 1: Past performance is not a reliable indicator of future performance.
Note 2: Investment decisions should be made depending on an individual’s appetite for upside potential, risks, and any previous holdings. This report is purely based on technical analysis, and fundamental analysis has not been considered in this report.
Note 3: Related Risks: This report may be looked at from a high-risk perspective, and directions are provided for a short duration. The analysis provided in this report is solely based on technical parameters, and the fundamental performance of the stocks has not been considered in the decision-making process. Other factors which could impact on stock prices include market risks, regulatory risks, interest rates risks, currency risks, social and political instability risks etc.
Note 4: How to Read the Charts?
The Green colour line reflects the 21-period moving average, while the red line indicates the 50-period moving average. SMA helps to identify existing price trends. If the prices are trading below the 21-period and 50-period moving averages, then it shows prices are currently trading in a bearish trend.
The Black colour line in the chart’s lower segment reflects the Relative Strength Index (14-Period) which indicates price momentum and signals momentum in trend. A reading of 70 or above suggests overbought status while a reading of 30 or below suggests an oversold status.
The Blue colour bars in the chart’s lower segment show the volume of the stock. The volume is the number of shares that changed hands during a given day. Stocks with high volumes are more liquid than stocks with lesser volume as liquidity in stocks helps with easier and faster execution of the order.
The Orange colour lines are the trend lines drawn by connecting two or more price points and used for trend identification purposes. The trend line also acts as a line of support and resistance.
Technical Indicators Defined: -
Support: A level at which the stock prices tend to find support if they are falling, and a downtrend may take a pause backed by demand or buying interest. Support 1 refers to the nearby support level for the stock and if the price breaches the level, then Support 2 may act as the crucial support level for the stock.
Resistance: A level at which the stock prices tend to find resistance when they are rising, and an uptrend may take a pause due to profit booking or selling interest.
Parabolic SAR: Parabolic SAR is a trend-following indicator that acts as a trailing stop. If the price stops rising and reverses below SAR, it indicates the start of a downtrend with SAR above the price following like a trailing stop. Similarly, if the prices stop falling and move above SAR, it indicates the start of an uptrend with SAR below the price following like a trailing stop.
MACD-Histogram: Moving Average Convergence Divergence (MACD)-Histogram is the difference between the MACD and its signal line. A positive value of the MACD-Histogram indicates a positive crossover between MACD and its signal line, whereas a negative value indicates a negative crossover.
The reference date for all price data, currency, technical indicators, support, and resistance levels is October 03, 2023. The reference data in this report has been partly sourced from REFINITIV.
Abbreviations
CMP: Current Market Price
SMA: Simple Moving Average
USD: United States Dollar
RSI: Relative Strength Index
Note: Trading decisions require a thorough analysis by individuals. Technical reports in general chart out metrics that may be assessed by individuals before any stock evaluation. The above are illustrative analytical factors used for evaluating stocks; other parameters can be looked at along with additional risks per se. Past performance is neither an indicator nor a guarantee of future performance.
 US
US  AU
AU UK
UK CA
CA NZ
NZ Please wait processing your request...