Please take a few seconds to register for free and gain access to...
7-Days Free Trial, no credit card required
![]() Trusted by 20K+ Investors
Trusted by 20K+ Investors

Scan to Download
Download the app and activate your free trial
Get a macro view on listed stocks segmented by sector, or market capitalization.
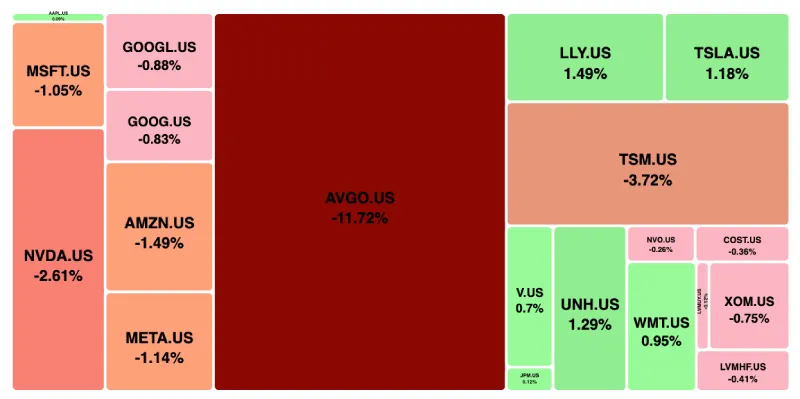
Note: Top 20 stocks by Market Cap (Daily % price change)
Note: Daily price change (%) by sector excluding stocks with ±90% daily price change. Companies above $500 million market capitalization are considered.
Data Powered by EODHD
81.95%
Mid - Cap
Entry Price :
43.54%
US Dividend Income Report
Entry Price :
33.50%
Global Green Energy Report
Entry Price :
23.54%
Diversified Opportunities Report
Entry Price :
5.87%
Small-Cap
Entry Price :
28.87%
Small-Cap
Entry Price :
88.26%
Small-Cap
Entry Price :

Our Recommendation Speaks!
Learn More about past recommendationsPast performance is neither an indicator nor a guarantee of future performance.
| Code | Buy Price | Sell Price | Gain/Loss | Entry Date | Exit Date | Days |
|---|---|---|---|---|---|---|
| NYSE: UEC | 3.24 | 4.88 | 50.62% | 25-Feb-2022 | 25-Mar-2022 | 28 |
| NASDAQ: MDB | 361.65 | 507.41 | 40.30% | 06-Aug-2021 | 03-Sep-2021 | 28 |
| NASDAQ: CERE | 25.51 | 35.19 | 37.95% | 06-Aug-2021 | 03-Sep-2021 | 28 |
| NYSE: RIG | 4.75 | 4.10 | -13.68% | 02-Jul-2021 | 14-Jul-2021 | 12 |
| NYSE: HIMS | 8.70 | 7.50 | -13.79% | 10-Sep-2021 | 01-Oct-2021 | 21 |
| NASDAQ: VFF | 2.28 | 1.94 | -14.91% | 07-Oct-2022 | 19-Oct-2022 | 12 |
 Please wait processing your request...