AAPL 190.415 0.3663% MSFT 422.65 -0.1016% GOOG 175.36 0.8512% GOOGL 174.14 0.9449% AMZN 185.71 -0.1505% NVDA 943.46 -0.3001% META 473.555 -1.6582% TSLA 174.87 0.5058% TSM 154.06 -0.977% LLY 776.1758 -1.3779% V 280.145 -0.2972% AVGO 1436.4972 0.0228% JPM 204.205 1.0366% UNH 522.225 0.9033% NVO 133.03 -1.2105% WMT 63.485 6.109% LVMUY 170.79 -0.2511% XOM 117.87 -0.5988% LVMHF 855.728 -0.1473% MA 461.6867 0.805%
Global Commodity Market Wrap-Up
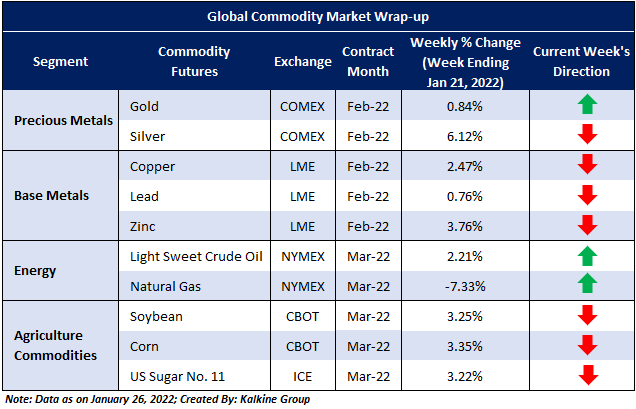
Last week, most of the commodities witnessed a volatile movement ahead of the U.S. Federal meeting which is expected to occur this week. Although the US Dollar index moved upside and gained ~0.50% weekly. The ongoing geopolitical issue between Russia and Ukraine supported the bullion further and the precious metals continued to gain strength last week as well. Notably, the movement was led by Silver with a weekly gain of 6.12% followed by Gold with an overall 0.84% weekly gain.
Base metals were also up last week where Nickel prices again made a new high and gained 8.50% weekly. Notably, Zinc, Copper, and Lead prices witnessed weekly gains of 3.76%, 2.47%, and 0.76% respectively.
On the Energy front, Natural Gas prices showed a downside correction after a steep rise and settled with a weekly loss of 7.33% last week; however, Crude Oil continued its bullish run with 2.21% weekly gains. Most of the agricultural commodities traded on a positive note where Corn, Soybean, and Sugar prices witnessed weekly gains of 3.35%, 3.25%, and 3.22% respectively.
In the current week, most of the commodities are trading in a weak note; however, the energy sector is still trending. Silver prices are correcting after last week's gains, while gold is still trading in green. Base metals prices are trading marginally down followed by the agricultural commodities.
The upcoming macro events that may impact the market sentiments include FOMC statement, Advance GDP, Core PCE Price Index, Pending Home Sales, Core Durable Goods, US Unemployment Claims, Consumer Sentiment, ISM Manufacturing PMI, etc.
Having understood the global commodities performance over the past one week, taking cues from major global economic events, and based on our technical analysis, noted below are our recommendations with the generic insights, entry price, target prices, and stop-loss for Natural Gas March Futures (NYMEX: NGH22) and Coffee C March Futures (ICE: KCH2) for the next 1-2 weeks’ duration:

Natural Gas March Futures Contract (NYMEX: NGH22)
Price Action and Technical Indicator Analysis:
On the daily chart, NYMEX Natural Gas March Futures price broke a downward sloping trend line resistance at USD 3.750 level by an upside as on January 24, 2022 and is hovering around the downward sloping trend line. Moreover, the prices are trading above the trend-following indicator 21-period SMA, indicating bullish momentum. Further, RSI (14-period) is trading at ~50.23 level, indicating positive momentum. Now the next crucial resistance level appears to be at USD 4.200, and prices may test that level in the coming sessions (1-2 weeks).

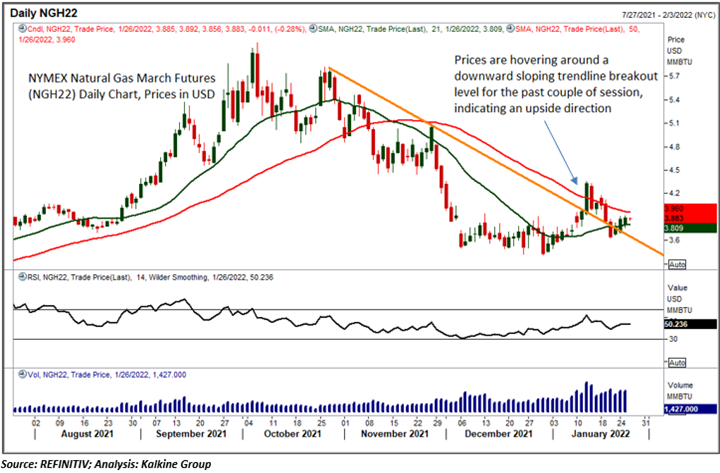
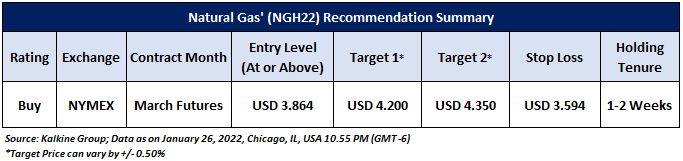
As per the above-mentioned price action and technical indicators analysis, we can conclude that Natural Gas March Futures (NGH22) is looking technically well-placed for a ‘Buy’ rating. Investment decision should be made depending on an investors’ appetite for upside potential, risks, and any previous holdings. This recommendation is purely based on technical analysis, and fundamental analysis has not been considered. Technical summary of our ‘Buy’ recommendations is as follows:
Coffee C March Futures (ICE: KCH2)
Price Action and Technical Indicator Analysis:
ICE Coffee C March Futures prices are sustaining above an upward sloping trend line support level at USc 233.30 and continuously taking support of the same. Moreover, prices are moving in higher tops and higher bottoms formation, supporting a positive bias.
The leading indicator RSI (14-period) is trading at ~52.92 level, indicating bullish momentum. Further, the prices are trading above the trend-following indicators 21-period SMA and 50-period SMA, which may act as a support level. Now the next crucial resistance level appears to be at USc 252.00, and prices may test this level in the coming sessions (1-2 weeks).
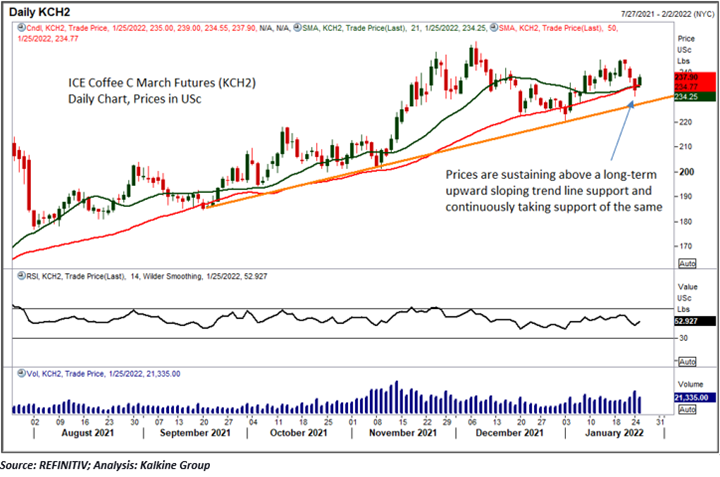

As per the above-mentioned price action and technical indicators analysis, we can conclude that Coffee C March Futures (KCH2) is looking technically well-placed for a ‘Buy’ rating. Investment decision should be made depending on an investors’ appetite for upside potential, risks, and any previous holdings. This recommendation is purely based on technical analysis, and fundamental analysis has not been considered. The summary of our ‘Buy’ recommendation is as follows:

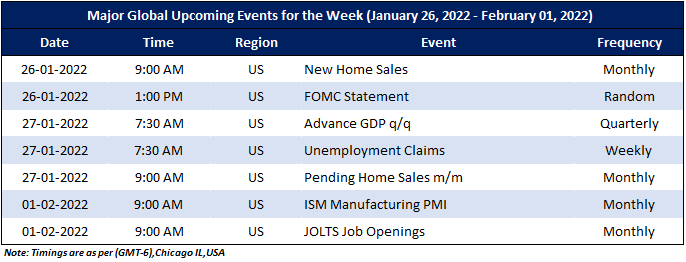
Upcoming Major Global Economic Events
Market events occur on a day-to-day basis depending on the frequency of the data and generally include an update on employment, inflation, GDP, WASDE report, consumer sentiments, etc. Noted below are the upcoming week's major global economic events that could impact the commodities prices:
Futures Contract Specifications

Disclaimers
Investment Related Risks: Based on the technical analysis, the risks are defined as per risk-reward ratio (~0.80:1.00), however, returns are generated within 1-2 weeks’ time frame. This may be looked at by Investors with sufficient risk appetite looking for returns within short investment duration. Investment recommendations provided in this report are solely based on technical parameters, and fundamental performance of the commodities has not been considered in the decision-making process. Other factors which could impact the commodity prices include market risks, regulatory risks, interest rates risk, currency risks, and social and political instability risks etc.
Note 1: Investors can consider exiting from the stock if the Target Price mentioned as per the Technical Analysis has been achieved and subject to the factors discussed above.
Note 2: How to Read the Charts?
The Green colour line reflects the 21-period moving average while the red line indicates the 50- period moving average. SMA helps to identify existing price trend. If the prices are trading above the 21-period and 50-period moving average, then it shows prices are currently trading in a bullish trend.
The Black colour line in the chart’s lower segment reflects the Relative Strength Index (14-Period) which indicates price momentum and signals momentum in trend. A reading of 70 or above suggests overbought status while a reading of 30 or below suggests an oversold status.
The Blue colour bars in the chart’s lower segment show the volume of the commodity. Commodity with high volumes is more liquid compared to the lesser ones. Liquidity in commodity helps in easier and faster execution of the order.
The Orange colour lines are the trend lines drawn by connecting two or more price points and used for trend identification purposes. The trend line also acts as a line of support and resistance.
Technical Indicators Defined: -
Support: A level where-in the stock prices tend to find support if they are falling, and downtrend may take a pause backed by demand or buying interest.
Resistance: A level where-in the stock prices tend to find resistance when they are rising, and uptrend may take a pause due to profit booking or selling interest.
Stop-loss: It is a level to protect further losses in case of unfavourable movement in the stock prices.
Risk Reward Ratio: Risk reward ratio is the difference between an entry point to a stop loss and profit level. We suggest ~80% Stop Loss of the Target 1 from the entry point.
The reference date for all price data, volumes, technical indicators, support, and resistance levels is January 26, 2022 (Chicago, IL, USA 10:55 PM (GMT -6). The reference data in this report has been partly sourced from REFINITIV.
Note: Trading decisions require a thorough analysis by investors. Technical reports in general chart out metrics that may be assessed by investors before any commodity evaluation. The above are illustrative analytical factors used for evaluating the commodity; other parameters can be looked at along with additional risks per se.
Kalkine Equities LLC provides general information about companies and their securities. The information contained in the reports, including any recommendations regarding the value of or transactions in any securities, does not take into account any of your investment objectives, financial situation or needs. Kalkine Equities LLC is not registered as an investment adviser in the U.S. with either the federal or state government. Before you make a decision about whether to invest in any securities, you should take into account your own objectives, financial situation and needs and seek independent financial advice. All information in our reports represents our views as at the date of publication and may change without notice.
Kalkine Media LLC, an affiliate of Kalkine Equities LLC, may have received, or be entitled to receive, financial consideration in connection with providing information about certain entity(s) covered on its website.
 US
US  AU
AU UK
UK CA
CA NZ
NZ Please wait processing your request...