
Section 1: Company Overview and Fundamentals
1.1 Company Overview:
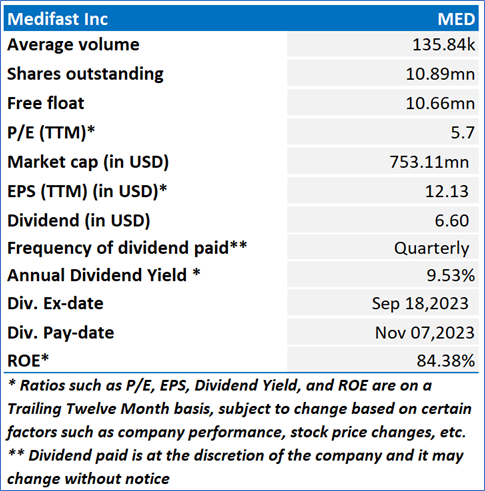
Medifast, Inc. (NYSE: MED) sells a variety of weight loss, weight management, and healthy living products all based on its own formulas under the OPTAVIA, Optimal Health by Taking Shape for Life, and Flavors of Home brands. The Company’s product line includes approximately 95 consumable options, including, but not limited to, bars, bites, pretzels, puffs, cereal crunch, drinks, hearty choices, oatmeal, pancakes, pudding, soft serve, shakes, smoothies, soft bakes, and soups.
Kalkine’s Diversified Opportunities Report covers the Company Overview, Key positives & negatives, Investment summary, Key investment metrics, Top 10 shareholding, Business updates and insights into company recent financial results, Key Risks & Outlook, Price performance and technical summary, Target Price, and Recommendation on the stock.
Stock Performance:
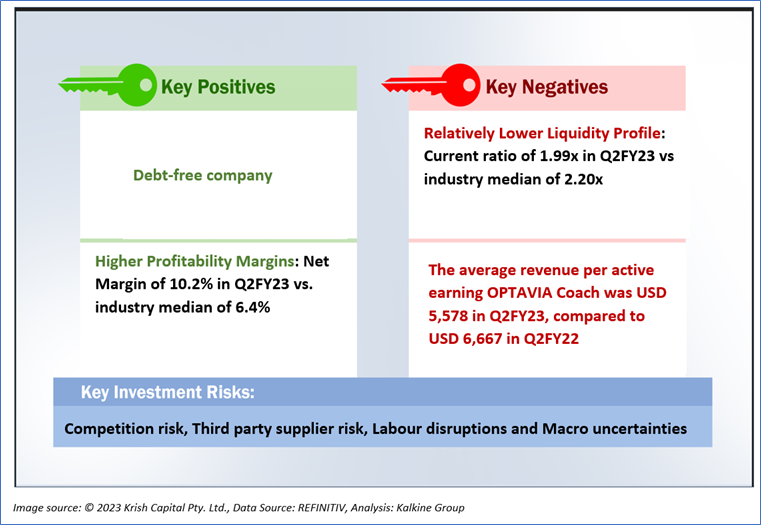
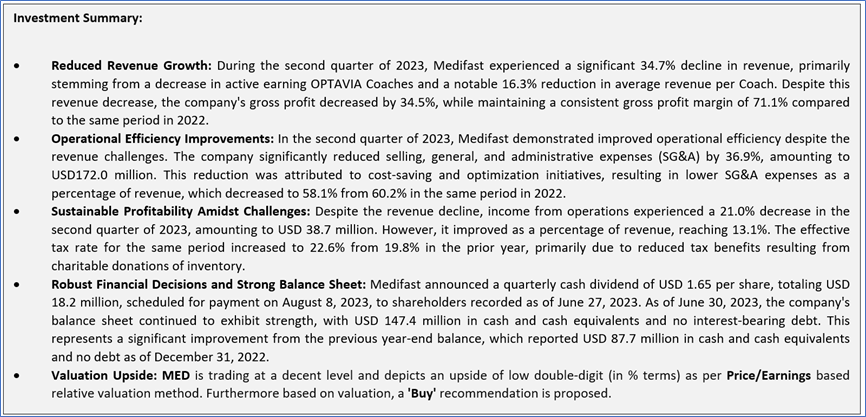
1.2 The Key Positives, Negatives, and Investment summary
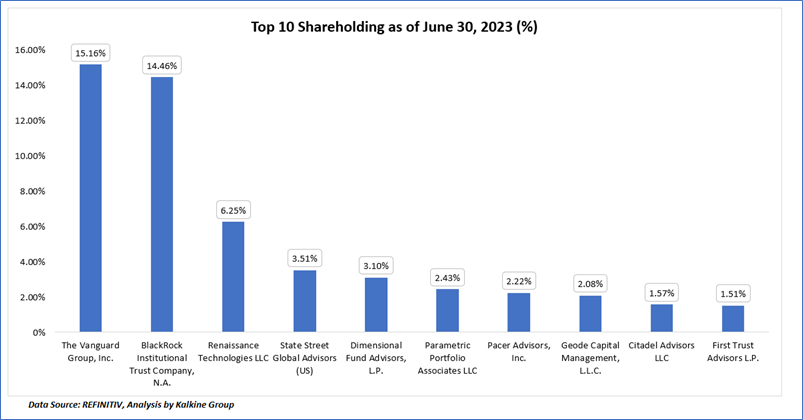
1.3 Top 10 shareholders:
The top 10 shareholders together form ~2.89% of the total shareholding, signifying diverse shareholding. The Vanguard Group, Inc., and BlackRock Institutional Trust Company, N.A. are the biggest shareholders, holding the maximum stake in the company at ~15.16% and ~14.46%, respectively.
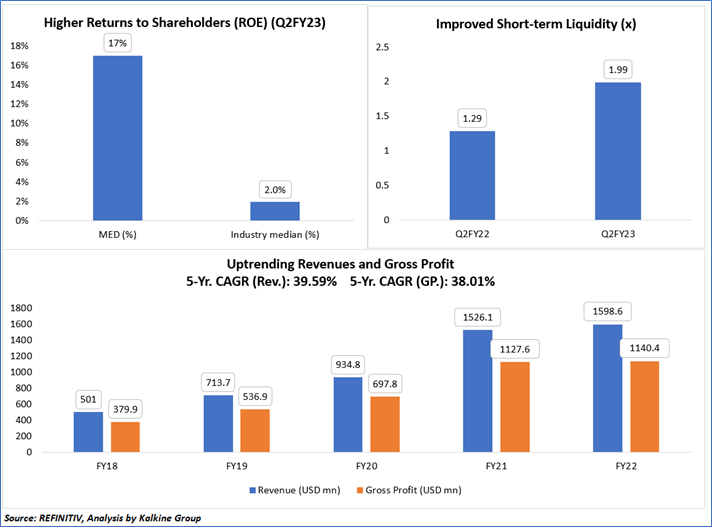
1.4 Key Metrics:
In the financial performance analysis of MED, presented as a percentage of industry median figures, several key metrics were evaluated over the years FY18 to FY22. The revenue for MED increased significantly during this period, growing from 501 million USD in FY18 to 1598.6 million USD in FY22, demonstrating a compound annual growth rate (CAGR) of approximately 39.59%. Gross profit also exhibited substantial growth, rising from 379.9 million USD in FY18 to 1140.4 million USD in FY22, reflecting a CAGR of approximately 38.01%. Additionally, the return on equity (ROE) for MED in Q2FY23 stood at 17%, which is notably higher than the industry median of 2.0%. In terms of leverage, the Current ratio for MED increased from 1.29 in Q2FY22 to 1.99 in Q2FY23.
Section 2: Business Updates and Corporate Business Highlights
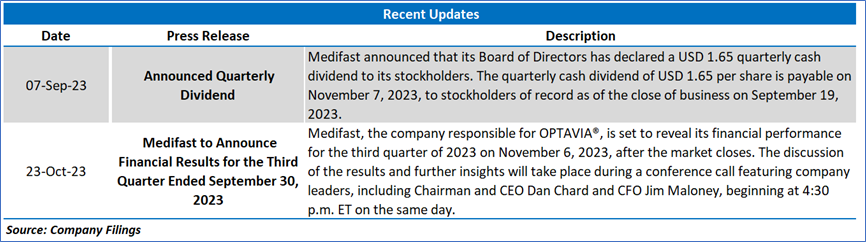
2.1 Recent Updates:
The below picture gives an overview of the recent updates:
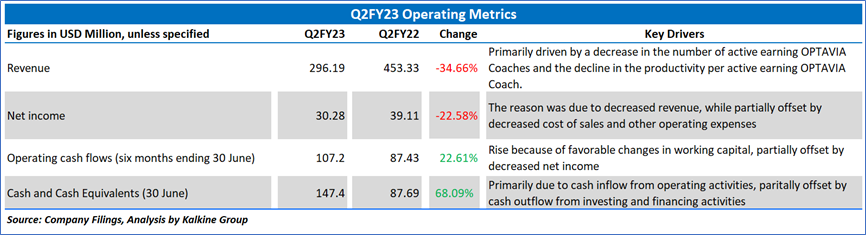
2.2 Insights of Q2FY23:
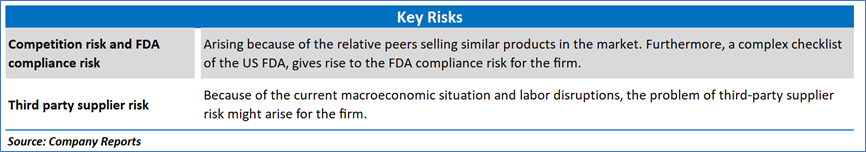
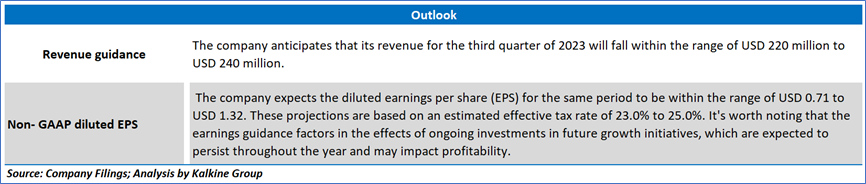
Section 3: Key Risks & Outlook
Section 4: Stock Recommendation Summary:
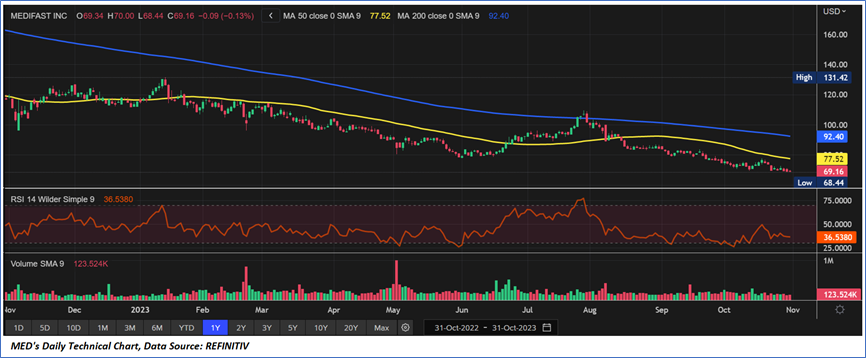
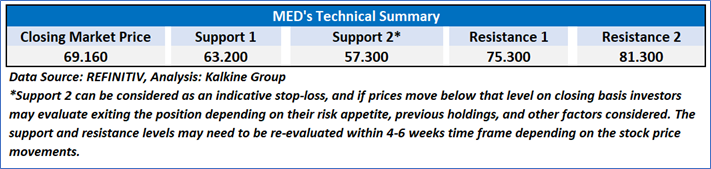
4.1 Price Performance and Technical Summary:
Stock Performance:
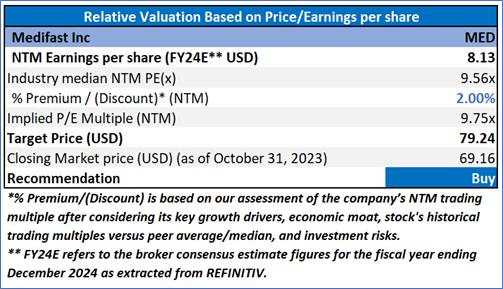
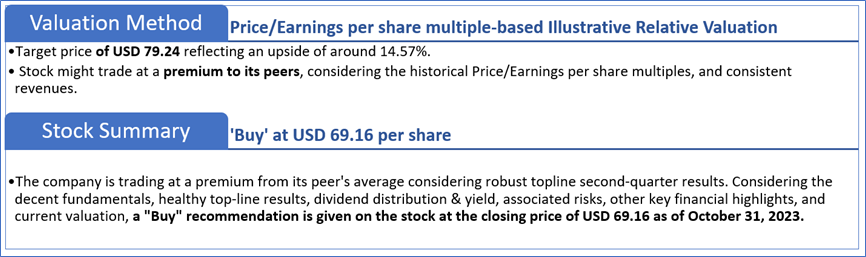
4.2 Fundamental Valuation
Valuation Methodology: Price/Earnings Multiple Based Relative Valuation
Markets are trading in a highly volatile zone currently due to certain macroeconomic issues and geopolitical tensions prevailing. Therefore, it is prudent to follow a cautious approach while investing.
Note 1: Past performance is not a reliable indicator of future performance.
Note 2: The reference date for all price data, currency, technical indicators, support, and resistance levels is October 31, 2023. The reference data in this report has been partly sourced from REFINITIV.
Note 3: Investment decisions should be made depending on an individual's appetite for upside potential, risks, holding duration, and any previous holdings. An 'Exit' from the stock can be considered if the Target Price mentioned as per the Valuation and or the technical levels provided has been achieved and is subject to the factors discussed above.
Note 4: The report publishing date is as per the Pacific Time Zone.
Technical Indicators Defined: -
Support: A level at which the stock prices tend to find support if they are falling, and a downtrend may take a pause backed by demand or buying interest. Support 1 refers to the nearby support level for the stock and if the price breaches the level, then Support 2 may act as the crucial support level for the stock.
Resistance: A level at which the stock prices tend to find resistance when they are rising, and an uptrend may take a pause due to profit booking or selling interest. Resistance 1 refers to the nearby resistance level for the stock and if the price surpasses the level, then Resistance 2 may act as the crucial resistance level for the stock.
Stop-loss: It is a level to protect against further losses in case of unfavorable movement in the stock prices.
Kalkine Equities LLC provides general information about companies and their securities. The information contained in the reports, including any recommendations regarding the value of or transactions in any securities, does not take into account any of your investment objectives, financial situation or needs. Kalkine Equities LLC is not registered as an investment adviser in the U.S. with either the federal or state government. Before you make a decision about whether to invest in any securities, you should take into account your own objectives, financial situation and needs and seek independent financial advice. All information in our reports represents our views as at the date of publication and may change without notice.
Kalkine Media LLC, an affiliate of Kalkine Equities LLC, may have received, or be entitled to receive, financial consideration in connection with providing information about certain entity(s) covered on its website.
Past performance is not a reliable indicator of future performance.
 Please wait processing your request...