 CA
 NZ
 UK
 AU
 IND

 US


…
BioXcel Therapeutics, Inc., together with its subsidiary, OnkosXcel Therapeutics LLC, operates as a biopharmaceutical company that utilizes artificial intelligence approaches to develop medicines in neuroscience and immuno-oncology in the United States. The company IGALMI, a sublingual film for the acute treatment of agitation associated with schizophrenia or bipolar I or II disorder in adults. It also develops its neuroscience candidate, BXCL501, which is an investigational, proprietary, orally dissolving film formulation of dexmedetomidine in Phase 3 trial for the treatment of agitation associated with bipolar disorders, schizophrenia, and Alzheimer's disease, as well as opioid use disorder, alcohol use disorder with comorbid post-traumatic stress disorder, and acute stress disorder; and its immune-oncology candidate, BXCL701, which is an investigational oral innate immune activator that has completed Phase 1b/2a trial for the treatment of aggressive forms of prostate cancer, pancreatic cancer, and other solid and liquid tumors. In addition, the company engages in the development of BXCL502 for the treatment of stress-related neuropsychiatric symptoms in dementia and other stress-related disorders; BXCL503, a drug candidate to target apathy in dementia; and BXCL504, which has the potential to address apathy and aggression in dementia. The company has collaborations with Columbia University, Yale University Medical School, and University of North Carolina for the development of BXCL501. BioXcel Therapeutics, Inc. was incorporated in 2017 and is headquartered in New Haven, Connecticut.
Source: TradingView
The charts and visual representations are sourced from TradingView through embedded widgets. For any issues with chart display, please visit the TradingView website
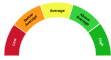
A unique technical analysis driven score developed by Kalkine showing momentum in stock prices based on select technical indicators identified.
BioXcel Therapeutics uses an AI-driven platform to identify and develop therapies in neuroscience and immuno-oncology, and has advanced a sublingual dexmedetomidine product for acute agitation in psychiatric settings. Long-term growth drivers include commercialization and uptake of that product, expansion into additional indications, pipeline clinical progress, and partnering or licensing opportunities that could leverage its AI-enabled discovery approach.
Key investment risks include commercialization and reimbursement execution for its approved product, clinical and regulatory setbacks across pipeline programs, competitive alternatives in acute agitation care, and limited financial resources that may require funding.

Note: The summary and risk score provided above is created by AI and should not be construed as a recommendation of Kalkine.


| Breakdown | 2025-12-31 | 2024-12-31 | 2023-12-31 | 2022-12-31 | 2021-12-31 |
|---|---|---|---|---|---|
| Type | yearly | yearly | yearly | yearly | yearly |
| Date | 2025-12-31 | 2024-12-31 | 2023-12-31 | 2022-12-31 | 2021-12-31 |
| Income before tax | -69.90M | -59.60M | -179.05M | -165.76M | -106.93M |
| Net income | -69.90M | -59.60M | -179.05M | -171.85M | -106.63M |
| Selling general administrative | 20.49M | 33.10M | 63.51M | 68.76M | 54.23M |
| Selling and marketing expenses | - | 1.39M | 19.90M | - | - |
| Gross profit | 0.18M | 0.12M | 0.12M | 0.35M | - |
| Reconciled depreciation | 0.30M | 0.31M | 0.32M | 0.33M | 0.30M |
| Ebit | -49.70M | -44.47M | -165.74M | -159.65M | -107.23M |
| Ebitda | -49.41M | -44.16M | -165.42M | -157.54M | -106.94M |
| Depreciation and amortization | 0.30M | 0.31M | 0.32M | 2.10M | 0.30M |
| Non operating income net other | - | - | - | 2.10M | 0.04M |
| Operating income | -49.70M | -67.25M | -171.78M | -159.65M | -106.94M |
| Other operating expenses | 50.35M | 69.51M | 173.16M | 160.02M | 106.94M |
| Interest expense | 16.98M | 15.13M | 13.31M | 8.21M | 0.04M |
| Interest income | 1.07M | 2.60M | 6.19M | 2.53M | 0.04M |
| Net interest income | -15.92M | -12.53M | -6.61M | -5.68M | 0.00M |
| Income tax expense | - | - | 0.15M | 6.09M | -0.30M |
| Total revenue | 0.64M | 2.27M | 1.38M | 0.38M | 0.00M |
| Total operating expenses | 49.88M | 67.37M | 171.90M | 160.00M | 106.94M |
| Cost of revenue | 0.46M | 2.14M | 1.26M | 0.02M | - |
| Total other income expense net | -20.19M | 7.65M | -7.27M | -6.11M | 0.00M |
| Net income from continuing ops | -69.90M | -59.60M | -211.60M | -165.76M | -106.93M |
| Net income applicable to common shares | - | - | - | -165.76M | -106.93M |
| Breakdown | 2025-12-31 | 2024-12-31 | 2023-12-31 | 2022-12-31 | 2021-12-31 |
|---|---|---|---|---|---|
| Type | yearly | yearly | yearly | yearly | yearly |
| Date | 2025-12-31 | 2024-12-31 | 2023-12-31 | 2022-12-31 | 2021-12-31 |
| Total assets | 44.92M | 38.34M | 73.70M | 205.85M | 239.44M |
| Other current assets | 15.31M | 6.73M | 4.86M | 3.84M | 0.96M |
| Total liab | 140.38M | 131.44M | 130.21M | 129.08M | 17.77M |
| Total stockholder equity | -95.46M | -93.10M | -56.51M | 76.78M | 221.67M |
| Deferred long term liab | - | - | - | 2.34M | - |
| Other current liab | 14.29M | 5.78M | 13.15M | 22.35M | 11.70M |
| Common stock | 0.08M | 0.05M | 0.03M | 0.03M | 0.03M |
| Capital stock | 0.08M | 0.05M | 0.03M | 0.03M | 0.03M |
| Retained earnings | -720.09M | -650.20M | -590.60M | -411.55M | -245.79M |
| Other liab | - | - | - | 2.34M | - |
| Other assets | - | - | 0.00M | 0.93M | 0.09M |
| Cash | 28.41M | 29.85M | 65.22M | 193.72M | 232.97M |
| Total current liabilities | 53.93M | 22.23M | 27.27M | 32.90M | 16.67M |
| Current deferred revenue | - | - | 0.12M | - | - |
| Net debt | 81.18M | 73.09M | 36.16M | -99.57M | -231.57M |
| Short term debt | 24.93M | 0.37M | 0.35M | 0.32M | 0.29M |
| Short long term debt | 24.93M | - | - | - | - |
| Short long term debt total | 109.59M | 102.95M | 101.38M | 94.16M | 1.40M |
| Other stockholder equity | 624.55M | 557.05M | 534.06M | 488.29M | 467.43M |
| Property plant equipment | - | - | - | 1.08M | 1.29M |
| Total current assets | 44.69M | 37.39M | 72.14M | 202.87M | 232.97M |
| Net tangible assets | - | - | - | 76.78M | 221.67M |
| Net receivables | 0.23M | 0.13M | 0.07M | 0.25M | - |
| Long term debt | 84.66M | 102.51M | 100.60M | 93.05M | - |
| Inventory | 0.72M | 0.68M | 1.99M | 1.99M | - |
| Accounts payable | 14.70M | 15.99M | 13.65M | 10.23M | 4.68M |
| Common stock total equity | - | - | - | 0.03M | 0.03M |
| Retained earnings total equity | - | - | - | -411.55M | -245.79M |
| Non currrent assets other | - | 0.09M | 0.09M | 0.93M | 3.93M |
| Non current assets total | 0.23M | 0.94M | 1.56M | 2.98M | 6.47M |
| Capital lease obligations | 0.07M | 0.44M | 0.79M | 1.10M | 1.40M |
| Long term debt total | - | - | - | 93.05M | - |
| Breakdown | 2025-12-31 | 2024-12-31 | 2023-12-31 | 2022-12-31 | 2021-12-31 |
|---|---|---|---|---|---|
| Type | yearly | yearly | yearly | yearly | yearly |
| Date | 2025-12-31 | 2024-12-31 | 2023-12-31 | 2022-12-31 | 2021-12-31 |
| Investments | - | 0.00M | -0.02M | -0.14M | -0.45M |
| Change to liabilities | - | - | - | 16.83M | 4.85M |
| Total cashflows from investing activities | - | - | -0.02M | -0.14M | -0.45M |
| Net borrowings | 0.00M | -2.50M | 0.00M | 95.95M | 98.60M |
| Total cash from financing activities | 56.52M | 36.66M | 26.52M | 96.24M | 102.45M |
| Change to operating activities | - | - | - | 0.68M | 0.13M |
| Net income | -69.90M | -59.60M | -179.05M | -165.76M | -106.93M |
| Change in cash | -1.10M | -35.37M | -128.50M | -39.24M | 19.85M |
| Begin period cash flow | 29.85M | 65.22M | 193.72M | 232.97M | 213.12M |
| End period cash flow | 28.76M | 29.85M | 65.22M | 193.72M | 232.97M |
| Total cash from operating activities | -57.62M | -72.03M | -155.01M | -135.34M | -82.15M |
| Issuance of capital stock | 58.14M | 39.69M | 24.66M | 0.00M | 100.99M |
| Depreciation | 0.30M | 0.31M | 0.32M | 0.33M | 0.30M |
| Change to inventory | -0.04M | 1.31M | -0.01M | -1.99M | -1.99M |
| Change to account receivables | -0.10M | -0.06M | 0.18M | -0.25M | -0.25M |
| Sale purchase of stock | - | - | -0.03M | 0.28M | 102.45M |
| Other cashflows from financing activities | -0.02M | -0.53M | -0.51M | 96.24M | 1.45M |
| Change to netincome | - | - | - | 18.55M | 19.50M |
| Capital expenditures | 0.00M | 0.00M | 0.02M | 0.14M | 0.45M |
| Change receivables | - | - | - | -0.25M | - |
| Cash flows other operating | - | - | - | -3.93M | 0.13M |
| Cash and cash equivalents changes | - | - | - | -39.24M | 19.85M |
| Change in working capital | -1.70M | -6.03M | 2.02M | 10.67M | 4.98M |
| Stock based compensation | 2.77M | 6.16M | 18.61M | 17.34M | 19.45M |
| Other non cash items | 10.92M | -12.86M | 3.10M | 2.08M | 0.05M |
| Free cash flow | -57.62M | -72.03M | -155.03M | -135.48M | -82.60M |
Sector: Healthcare Industry: Drug Manufacturers - Specialty & Generic
|
Stock Name
|
Change
(USD) |
Price
(USD) |
Trailing
PE (x) |
Forward
PE (x) |
Price Sales
TTM (x) |
Price to Book Value (x)
|
Enterprise Value
to Revenue (x) |
Enterprise Value
to EBITDA (x) |
|---|---|---|---|---|---|---|---|---|
| MKKGY Merck KGaA ADR |
-0.22 0.66% |
33.17 | 21.25 | 14.93 | 3.10 | 2.14 | 3.60 | 12.98 |
| MKGAF MERCK Kommanditgesellschaft auf Aktien |
-2.76 1.62% |
167.12 | 24.86 | 15.11 | 3.13 | 1.98 | 3.08 | 18.89 |
| TAK Takeda Pharmaceutical Co Ltd ADR |
-0.17 0.80% |
21.02 | - | 10.96 | 0.01 | 1.20 | 2.94 | 23.11 |
| TKPHF Takeda Pharmaceutical Co. Ltd. |
- -% |
41.85 | - | 10.66 | 0.01 | 1.16 | 2.94 | 23.11 |
BioXcel Therapeutics, Inc., together with its subsidiary, OnkosXcel Therapeutics LLC, operates as a biopharmaceutical company that utilizes artificial intelligence approaches to develop medicines in neuroscience and immuno-oncology in the United States. The company IGALMI, a sublingual film for the acute treatment of agitation associated with schizophrenia or bipolar I or II disorder in adults. It also develops its neuroscience candidate, BXCL501, which is an investigational, proprietary, orally dissolving film formulation of dexmedetomidine in Phase 3 trial for the treatment of agitation associated with bipolar disorders, schizophrenia, and Alzheimer's disease, as well as opioid use disorder, alcohol use disorder with comorbid post-traumatic stress disorder, and acute stress disorder; and its immune-oncology candidate, BXCL701, which is an investigational oral innate immune activator that has completed Phase 1b/2a trial for the treatment of aggressive forms of prostate cancer, pancreatic cancer, and other solid and liquid tumors. In addition, the company engages in the development of BXCL502 for the treatment of stress-related neuropsychiatric symptoms in dementia and other stress-related disorders; BXCL503, a drug candidate to target apathy in dementia; and BXCL504, which has the potential to address apathy and aggression in dementia. The company has collaborations with Columbia University, Yale University Medical School, and University of North Carolina for the development of BXCL501. BioXcel Therapeutics, Inc. was incorporated in 2017 and is headquartered in New Haven, Connecticut.

555 Long Wharf Drive, New Haven, CT, United States, 06511

475 238 6837

29
| Name | Title | Year Born |
|---|---|---|
| Dr. Vimal D. Mehta Ph.D. | Founder, CEO, Pres, & Director | 1961 |
| Dr. Frank D. Yocca Ph.D. | Sr. VP & Chief Scientific Officer | 1956 |
| Mr. Javier Rodriguez | Sr. VP, Chief Legal Officer & Corp. Sec. | 1972 |
| Dr. Krishnan Nandabalan Ph.D. | Chief Digital Officer ?& Director | 1963 |
| Mr. Richard I. Steinhart MBA | Sr. VP & CFO | 1957 |
| Ms. Mary Coleman | VP of Investment Relations | NA |
| Dr. Iris Francesconi Ph.D. | Sr. VP of Marketing, Market Research & Commercial Assessments | NA |
| Dr. Vincent J. O'Neill M.D., B.Sc., M.R.C.P. | Sr. VP & Chief Medical Officer | 1969 |
| Dr. Cedric Burg | VP and Head of Global Clinical Operations & Project Management | NA |
| Dr. Chetan D. Lathia Ph.D. | Sr. VP and Head of Translational Medicine, Clinical Pharmacology & Regulatory Affairs | NA |
Disclaimer - (*)This information, including any data, is sourced from Unicorn Data Services SAS, trading as EOD Historical Data (“EODHD”) on an ‘as is’ basis, using their API. We cannot guarantee the completeness or validity of the information and data provided on this page, as well as via the API. In some cases, the data may include analyst ratings or recommendations sourced through the EODHD API, which are intended solely for general information purposes.
This information does not consider your personal objectives, financial situation, or needs. Kalkine is not liable for any errors or omissions in the information provided or for any actions taken in reliance on it. You should seek advice from a financial adviser, stockbroker or other professional adviser (including taxation and legal advice) as necessary before acting on this information.

Download a free report with stock ideas and industry insights for general information.
Download Free Report Now →


Basic Materials
 +0.61%
Communication Services
 -0.21%

Consumer Cyclical
-0.26%

Consumer Defensive
-0.37%

Energy
+0.23%

Financial Services
-0.43%
Financials
+0.39%

Healthcare
+0.88%

Industrials
+0.36%

Real Estate
-0.51%

Technology
+1.35%

Utilities
+0.19%
Note: Daily price change (%) by sector excluding stocks with +/-90% daily price change. Companies above $500 million market capitalization are considered.
 Portfolio
 Watchlist


 Please wait processing your request...