 CA
 NZ
 UK
 AU
 IND

 US


…
CSW Industrials, Inc. provides various industrial products in the Americas, Europe, the Middle East and Africa, and the Asia Pacific regions. The Contractor Solutions segment offers condensate pads, pans, and pumps; condensate switches and traps; drain management system; drain waste and vent systems mechanical products; ductless mini-split systems installation support tools and accessories; HVAC electrical protection, installation supplies, and maintenance chemicals; evaporator coils and air handlers; grilles, registers, and diffusers and vents; line set covers; load management systems; motors and capacitors; refrigerant caps; solvents, cements, traps, and thread sealants; surge protections; and wire pulling head tools under the Amrad, AquaGuard, Aspen Manufacturing, Clean Check, Cover Guard, Desolv, Duckt-Strip, Dust Free, EZ Trap, Falcon, Fortress, Goliath, G-O-N, Guardian Drain Lock, Hubsett, Kickstart, Leak Freeze, MARS, No. 5, Novent, PF WaterWorks, PRO-Fit, PSP Products, RectorSeal, Safe-T-Switch, Shoemaker Manufacturing, SureSeal, TRU-BLU, TRUaire, and Turbo 200 brands. The Engineered Building Solutions segment offers architectural railings and metals; expansion joints and joint seals; fire and smoke curtains, and fire stopping solutions; perimeter protection; and pre-engineered and custom architectural building components under the Balco, BlazeSeal, Duraspan, Greco, IllumiTread, Jointspan, Metacaulk, Metablock, Metaflex, Quakespan, and Smoke Guard brands. The Specialized Reliability Solutions segment provides compounds, lubricants, and sealants; industrial maintenance and repair, anti-seize, contamination control, and desiccant breather filtration; lubricant management systems; operation solutions; andrail applicators, and friction modifiers under the AccuTrack, OilSafe, Air Sentry, BioRail, Deacon, Envirolube, Extreme, Gearmate, Hydrotex, Jet-Lube, Kopr-Kote, Matrix, and Whitmore brands. The company was incorporated in 2014 and is based in Dallas, Texas.
Source: TradingView
The charts and visual representations are sourced from TradingView through embedded widgets. For any issues with chart display, please visit the TradingView website
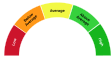
A unique technical analysis driven score developed by Kalkine showing momentum in stock prices based on select technical indicators identified.


| Breakdown | 2026-03-31 | 2025-03-31 | 2024-03-31 | 2023-03-31 | 2022-03-31 |
|---|---|---|---|---|---|
| Type | yearly | yearly | yearly | yearly | yearly |
| Date | 2026-03-31 | 2025-03-31 | 2024-03-31 | 2023-03-31 | 2022-03-31 |
| Income before tax | 145.53M | 180.12M | 140.48M | 125.91M | 91.47M |
| Minority interest | -0.80M | -0.83M | -0.89M | -0.14M | -0.93M |
| Net income | 112.03M | 136.65M | 101.65M | 96.44M | 66.39M |
| Selling general administrative | 269.52M | 198.63M | 179.09M | 169.75M | 158.58M |
| Selling and marketing expenses | - | 4.70M | 4.50M | 4.70M | - |
| Gross profit | 453.68M | 393.31M | 350.75M | 318.21M | 252.69M |
| Reconciled depreciation | 67.08M | 43.01M | 37.65M | 35.55M | 36.89M |
| Ebit | 182.78M | 180.39M | 161.25M | 138.97M | 96.69M |
| Ebitda | 249.86M | 223.39M | 198.90M | 174.52M | 133.06M |
| Depreciation and amortization | 67.08M | 43.01M | 37.65M | 35.55M | 36.37M |
| Operating income | 184.16M | 181.25M | 159.12M | 139.07M | 98.08M |
| Other operating expenses | 898.39M | 697.05M | 633.72M | 618.84M | 528.36M |
| Interest expense | 22.25M | 0.27M | 12.72M | 13.20M | 5.45M |
| Tax provision | 32.71M | 42.63M | 37.94M | 29.34M | 24.15M |
| Interest income | - | 0.27M | 12.42M | 12.80M | - |
| Net interest income | -22.25M | -0.27M | -12.72M | -13.20M | -5.45M |
| Extraordinary items | - | -0.56M | -0.49M | -0.90M | - |
| Income tax expense | 32.71M | 42.63M | 37.94M | 29.34M | 24.15M |
| Total revenue | 1082.55M | 878.30M | 792.84M | 757.90M | 626.43M |
| Total operating expenses | 269.52M | 212.06M | 191.63M | 179.15M | 154.61M |
| Cost of revenue | 628.87M | 484.99M | 442.10M | 439.69M | 373.75M |
| Total other income expense net | -38.63M | -1.13M | -18.64M | -13.15M | -6.62M |
| Net income from continuing ops | 112.85M | 137.48M | 102.54M | 96.57M | 67.32M |
| Net income applicable to common shares | - | 136.65M | 101.65M | 96.44M | - |
| Breakdown | 2026-03-31 | 2025-03-31 | 2024-03-31 | 2023-03-31 | 2022-03-31 |
|---|---|---|---|---|---|
| Type | yearly | yearly | yearly | yearly | yearly |
| Date | 2026-03-31 | 2025-03-31 | 2024-03-31 | 2023-03-31 | 2022-03-31 |
| Total assets | 2316.68M | 1379.07M | 1043.33M | 1043.45M | 995.36M |
| Intangible assets | 900.05M | 357.91M | 318.82M | 318.90M | 300.84M |
| Other current assets | 31.06M | 14.40M | 13.88M | 18.93M | 10.61M |
| Total liab | 1247.32M | 286.63M | 408.25M | 499.31M | 510.95M |
| Total stockholder equity | 1050.41M | 1072.25M | 615.72M | 525.67M | 469.09M |
| Other current liab | 118.99M | 74.78M | 55.29M | 56.97M | 52.49M |
| Common stock | 0.18M | 0.18M | 0.16M | 0.16M | 0.16M |
| Capital stock | 0.18M | 0.18M | 0.16M | 0.16M | 0.16M |
| Retained earnings | 798.96M | 705.03M | 583.08M | 493.32M | 407.52M |
| Good will | 632.63M | 264.09M | 247.19M | 242.74M | 224.66M |
| Other assets | - | 3.33M | 4.57M | 5.41M | - |
| Cash | 33.80M | 225.84M | 22.16M | 18.45M | 16.62M |
| Cash and equivalents | - | 225.84M | 22.16M | 18.45M | - |
| Total current liabilities | 226.92M | 147.20M | 115.84M | 108.04M | 117.40M |
| Current deferred revenue | 1.54M | 0.93M | 0.55M | 0.64M | 1.03M |
| Net debt | 898.18M | -156.48M | 211.41M | 299.92M | 308.70M |
| Short term debt | 29.46M | 11.24M | 9.44M | 9.78M | 9.83M |
| Short long term debt | 29.46M | - | - | - | 0.56M |
| Short long term debt total | 931.98M | 69.36M | 233.56M | 318.37M | 325.32M |
| Other stockholder equity | 262.55M | 379.16M | 41.61M | 40.60M | 66.48M |
| Property plant equipment | - | 155.48M | 137.30M | 148.05M | - |
| Total current assets | 589.07M | 592.86M | 331.41M | 323.06M | 300.15M |
| Long term investments | 7.30M | 2.50M | 0.00M | - | - |
| Short term investments | - | - | 1.19M | 0.88M | - |
| Net receivables | 213.57M | 157.74M | 144.62M | 124.10M | 122.80M |
| Long term debt | 839.84M | 0.00M | 166.00M | 253.00M | 252.21M |
| Inventory | 309.71M | 194.88M | 150.75M | 161.57M | 150.11M |
| Accounts payable | 76.93M | 54.77M | 48.39M | 40.65M | 47.84M |
| Accumulated other comprehensive income | -11.10M | -12.13M | -9.13M | -8.41M | -5.07M |
| Non currrent assets other | 79.20M | 5.88M | 5.83M | 7.80M | 15.31M |
| Non current assets total | 1727.62M | 786.20M | 711.92M | 720.40M | 695.21M |
| Capital lease obligations | 75.48M | 69.36M | 49.37M | 65.37M | 72.54M |
| Long term debt total | - | 0.00M | 166.00M | 253.00M | - |
| Breakdown | 2026-03-31 | 2025-03-31 | 2024-03-31 | 2023-03-31 | 2022-03-31 |
|---|---|---|---|---|---|
| Type | yearly | yearly | yearly | yearly | yearly |
| Date | 2026-03-31 | 2025-03-31 | 2024-03-31 | 2023-03-31 | 2022-03-31 |
| Investments | -4.80M | -102.22M | -42.50M | -69.72M | -51.46M |
| Total cashflows from investing activities | -1043.07M | -102.22M | -45.45M | -69.72M | -51.46M |
| Net borrowings | 871.50M | -166.00M | -87.00M | 0.23M | 10.44M |
| Total cash from financing activities | 701.47M | 138.05M | -114.07M | -49.29M | -13.04M |
| Net income | 112.85M | 137.48M | 101.65M | 96.57M | 67.32M |
| Change in cash | -192.05M | 203.69M | 3.70M | 1.84M | 6.53M |
| Begin period cash flow | 225.84M | 22.16M | 18.45M | 16.62M | 10.09M |
| End period cash flow | 33.80M | 225.84M | 22.16M | 18.45M | 16.62M |
| Total cash from operating activities | 149.65M | 168.36M | 164.33M | 121.45M | 69.09M |
| Issuance of capital stock | 0.00M | 347.41M | 0.00M | 0.00M | - |
| Depreciation | 67.08M | 43.01M | 37.65M | 35.55M | 36.89M |
| Other cashflows from investing activities | - | 1.23M | 2.19M | 0.12M | 0.14M |
| Dividends paid | 18.02M | 14.58M | 11.80M | 10.55M | 9.46M |
| Change to inventory | -36.75M | -35.70M | 10.36M | -11.42M | -49.40M |
| Change to account receivables | -27.08M | -9.12M | -17.90M | 1.10M | -26.73M |
| Sale purchase of stock | -132.75M | -27.69M | -15.27M | -39.07M | -19.31M |
| Other cashflows from financing activities | -19.03M | -1.08M | -2.95M | 0.11M | 5.29M |
| Capital expenditures | 17.26M | 16.27M | 16.57M | 13.95M | 15.65M |
| Change in working capital | -75.71M | -25.09M | 11.07M | -18.36M | -43.30M |
| Stock based compensation | 14.93M | 13.59M | 11.54M | 9.75M | 8.45M |
| Other non cash items | 36.54M | 6.29M | 4.92M | 3.94M | 3.00M |
| Free cash flow | 132.40M | 152.10M | 147.76M | 107.50M | 53.44M |
Sector: Industrials Industry: Specialty Industrial Machinery
|
Stock Name
|
Change
(USD) |
Price
(USD) |
Trailing
PE (x) |
Forward
PE (x) |
Price Sales
TTM (x) |
Price to Book Value (x)
|
Enterprise Value
to Revenue (x) |
Enterprise Value
to EBITDA (x) |
|---|---|---|---|---|---|---|---|---|
| CSW CSW Industrials, Inc. |
-0.54 0.19% |
284.00 | 40.16 | 42.55 | 4.03 | 4.45 | 4.77 | 20.99 |
| GEV GE Vernova LLC |
8.58 1.06% |
816.82 | 56.16 | 67.57 | 7.02 | 23.82 | 6.79 | 115.11 |
| SMAWF Siemens AG Class N |
-0.34 0.11% |
304.16 | 25.72 | 20.16 | 2.87 | 2.96 | 2.85 | 13.79 |
| SBGSF Schneider Electric SE |
-4.15 1.53% |
267.80 | 32.06 | 22.47 | 4.40 | 6.27 | 4.00 | 19.13 |
| ETN Eaton Corporation PLC |
-6.45 1.79% |
354.17 | 39.21 | 30.77 | 5.80 | 8.18 | 6.15 | 27.30 |
CSW Industrials, Inc. provides various industrial products in the Americas, Europe, the Middle East and Africa, and the Asia Pacific regions. The Contractor Solutions segment offers condensate pads, pans, and pumps; condensate switches and traps; drain management system; drain waste and vent systems mechanical products; ductless mini-split systems installation support tools and accessories; HVAC electrical protection, installation supplies, and maintenance chemicals; evaporator coils and air handlers; grilles, registers, and diffusers and vents; line set covers; load management systems; motors and capacitors; refrigerant caps; solvents, cements, traps, and thread sealants; surge protections; and wire pulling head tools under the Amrad, AquaGuard, Aspen Manufacturing, Clean Check, Cover Guard, Desolv, Duckt-Strip, Dust Free, EZ Trap, Falcon, Fortress, Goliath, G-O-N, Guardian Drain Lock, Hubsett, Kickstart, Leak Freeze, MARS, No. 5, Novent, PF WaterWorks, PRO-Fit, PSP Products, RectorSeal, Safe-T-Switch, Shoemaker Manufacturing, SureSeal, TRU-BLU, TRUaire, and Turbo 200 brands. The Engineered Building Solutions segment offers architectural railings and metals; expansion joints and joint seals; fire and smoke curtains, and fire stopping solutions; perimeter protection; and pre-engineered and custom architectural building components under the Balco, BlazeSeal, Duraspan, Greco, IllumiTread, Jointspan, Metacaulk, Metablock, Metaflex, Quakespan, and Smoke Guard brands. The Specialized Reliability Solutions segment provides compounds, lubricants, and sealants; industrial maintenance and repair, anti-seize, contamination control, and desiccant breather filtration; lubricant management systems; operation solutions; andrail applicators, and friction modifiers under the AccuTrack, OilSafe, Air Sentry, BioRail, Deacon, Envirolube, Extreme, Gearmate, Hydrotex, Jet-Lube, Kopr-Kote, Matrix, and Whitmore brands. The company was incorporated in 2014 and is based in Dallas, Texas.

5420 Lyndon B. Johnson Freeway, Dallas, TX, United States, 75240

214 884 3777

2700
| Name | Title | Year Born |
|---|---|---|
| Mr. Joseph Brooks Armes J.D. | Chairman, President & CEO | 1962 |
| Mr. James E. Perry | Executive VP & CFO | 1972 |
| Mr. Luke E. Alverson J.D. | Senior VP, General Counsel & Secretary | 1978 |
| Mr. Donal J. Sullivan | Executive VP & Chief Strategy Officer | 1963 |
| Mr. Jeff A. Underwood | Senior VP & GM of Contractor Solutions | 1983 |
| Ms. Fang Wang | Chief Accounting Officer & VP | NA |
| Ms. Alexa D. Huerta | VP of Investor Relations & Treasurer | NA |
| Ms. Danielle R. Garde | Senior VP & Chief People Officer | 1972 |
| Ms. Danielle R. Garde | Senior VP & Chief People Officer | 1971 |
| Mr. Jeff A. Underwood | Executive VP & GM of Contractor Solutions | 1982 |
Disclaimer - (*)This information, including any data, is sourced from Unicorn Data Services SAS, trading as EOD Historical Data (“EODHD”) on an ‘as is’ basis, using their API. We cannot guarantee the completeness or validity of the information and data provided on this page, as well as via the API. In some cases, the data may include analyst ratings or recommendations sourced through the EODHD API, which are intended solely for general information purposes.
This information does not consider your personal objectives, financial situation, or needs. Kalkine is not liable for any errors or omissions in the information provided or for any actions taken in reliance on it. You should seek advice from a financial adviser, stockbroker or other professional adviser (including taxation and legal advice) as necessary before acting on this information.

Download a free report with stock ideas and industry insights for general information.
Download Free Report Now →


Basic Materials
 -1.40%
Communication Services
-0.45%

Consumer Cyclical
-0.55%

Consumer Defensive
-0.01%

Energy
-0.01%

Financial Services
-0.40%
Financials
-0.15%

Healthcare
-1.15%

Industrials
-0.46%

Real Estate
-0.29%

Technology
-1.22%

Utilities
-0.10%
Note: Daily price change (%) by sector excluding stocks with +/-90% daily price change. Companies above $500 million market capitalization are considered.
 Portfolio
 Watchlist


 +0.55%
 Please wait processing your request...