 CA
 NZ
 UK
 AU
 IND

 US


…
Advanced Biomed Inc., an investment holding company, engages in the research and development of microfluidic biochip technologies for precision oncology detection, diagnosis, and treatment in Taiwan. Its devices include A+Pre, an automated sample preparation system that enables pre-concentration of diluted blood samples; AC-1000, a rare cell device to solve the problem of detection of hypercoagulable state samples of tumor patients; A+SCDrop, a circulating tumor cell (CTC) single-cell capture device; and A+CellScan, an analyzer with an immunostaining chip for immunostaining/analysis of the AC-1000 product. The company also offers microfluidic biochips, such as A+Pre, AC-1000 CTC enrichment, and A+CellScan chips to provide assay products and services to cancer patients. In addition, its immunochromogenic kits include A+CTCE kit to identify epithelial circulating tumor cells and determined by the immunochromogenicity of EpCAM, CK (pan), CD45, and CD14 antibodies; A+CTCM kit to identify mesenchymal circulating tumor cells based on the immunochromogenicity of Vimentin, CD45, and CD14 antibodies; A+EMT to identify epithelial-to-mesenchymal circulating tumor cells determined by the immunochromogenicity of cell-surface Vimentin, and CD45 and CD14 antibodies; and A+CM to identify tumor-associated macrophages based on the immunochromogenicity of PD-L1, CD45, and CD14 antibodies. Further, the company is developing A+LCGuard for early screening of lung cancer. Additionally, it establishes and operates medical clinics in the People's Republic of China. The company was founded in 2014 and is headquartered in New York, New York.
Source: TradingView
The charts and visual representations are sourced from TradingView through embedded widgets. For any issues with chart display, please visit the TradingView website
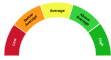
A unique technical analysis driven score developed by Kalkine showing momentum in stock prices based on select technical indicators identified.


| Breakdown | 2025-06-30 | 2024-06-30 | 2023-06-30 | 2022-06-30 | 2021-06-30 |
|---|---|---|---|---|---|
| Type | yearly | yearly | yearly | yearly | yearly |
| Date | 2025-06-30 | 2024-06-30 | 2023-06-30 | 2022-06-30 | 2021-06-30 |
| Income before tax | -0.10M | -2.78M | -3.73M | -4.03M | -1.84M |
| Net income | -0.10M | -2.78M | -3.73M | -4.03M | -1.84M |
| Selling general administrative | 2111.26M | 1.26M | 1.32M | 0.62M | 0.04M |
| Gross profit | -0.01M | -0.01M | -0.01M | -0.00M | -0.00M |
| Reconciled depreciation | - | 0.40M | 0.37M | 0.13M | 0.06M |
| Ebit | -0.10M | -2.54M | -3.07M | -2.37M | -1.84M |
| Ebitda | -0.09M | -2.14M | -2.71M | -2.24M | -1.78M |
| Depreciation and amortization | 0.01M | 0.40M | 0.37M | 0.13M | 0.06M |
| Operating income | -0.09M | -2.54M | -3.07M | -2.37M | -1.84M |
| Other operating expenses | 0.09M | 2.54M | 3.07M | 2.37M | 1.84M |
| Tax provision | - | 0.00M | 0.00M | 0.00M | 0.00M |
| Interest income | - | 0.05M | 0.02M | 0.00M | 0.00M |
| Net interest income | - | 0.05M | 0.02M | 0.00M | 0.00M |
| Total revenue | - | 0.00M | 0.00M | 0.00M | 0.00M |
| Total operating expenses | 0.08M | 2.54M | 3.07M | 2.37M | 1.84M |
| Cost of revenue | 0.01M | 0.01M | 0.01M | 0.00M | 0.00M |
| Total other income expense net | -0.01M | -0.24M | -0.66M | -1.65M | -0.00M |
| Net income from continuing ops | - | -2.78M | -3.73M | -4.03M | -1.84M |
| Breakdown | 2025-06-30 | 2024-06-30 | 2023-06-30 | 2022-06-30 | 2021-06-30 |
|---|---|---|---|---|---|
| Type | yearly | yearly | yearly | yearly | yearly |
| Date | 2025-06-30 | 2024-06-30 | 2023-06-30 | 2022-06-30 | 2021-06-30 |
| Total assets | 6512.34M | 4.46M | 4.60M | 6.71M | 1.01M |
| Intangible assets | - | 0.12M | 0.25M | 0.41M | - |
| Other current assets | 3128.65M | 0.44M | 0.16M | 0.22M | 0.85M |
| Total liab | 3034.78M | 2.80M | 3.29M | 3.22M | 0.03M |
| Total stockholder equity | 3477.56M | 1.66M | 1.31M | 3.49M | 0.98M |
| Other current liab | 2887.99M | 2.05M | 2.42M | 1.98M | 0.02M |
| Common stock | 21.64M | 0.02M | 0.02M | 0.10M | 0.01M |
| Capital stock | - | 0.02M | 0.02M | 0.10M | 0.01M |
| Retained earnings | -19233.04M | -15.97M | -13.19M | -9.46M | -5.43M |
| Cash | 2903.91M | 2.61M | 2.62M | 4.78M | 0.07M |
| Total current liabilities | 2889.13M | 2.73M | 3.28M | 2.99M | 0.03M |
| Net debt | -2902.65M | -2.48M | -2.38M | -4.31M | -0.06M |
| Short term debt | 1.12M | 0.06M | 0.22M | 0.24M | 0.01M |
| Short long term debt total | 1.26M | 0.13M | 0.24M | 0.48M | 0.01M |
| Other stockholder equity | 21348.01M | 16.49M | 13.67M | 12.58M | 6.57M |
| Total current assets | 6032.57M | 3.05M | 2.79M | 5.01M | 0.91M |
| Net receivables | 0.01M | 0.01M | 0.00M | 0.16M | 0.00M |
| Inventory | - | -0.01M | - | - | - |
| Accounts payable | 0.02M | 0.62M | 0.63M | 0.76M | 0.00M |
| Accumulated other comprehensive income | 1341.69M | 1.12M | 0.80M | 0.27M | -0.18M |
| Non currrent assets other | 414.37M | 0.64M | 0.61M | 0.07M | - |
| Non current assets total | 479.77M | 1.41M | 1.81M | 1.71M | 0.09M |
| Capital lease obligations | - | 0.13M | 0.24M | 0.47M | 0.01M |
| Breakdown | 2025-06-30 | 2024-06-30 | 2023-06-30 | 2022-06-30 | 2021-06-30 |
|---|---|---|---|---|---|
| Type | yearly | yearly | yearly | yearly | yearly |
| Date | 2025-06-30 | 2024-06-30 | 2023-06-30 | 2022-06-30 | 2021-06-30 |
| Investments | - | -0.07M | -0.26M | -1.08M | -0.03M |
| Total cashflows from investing activities | -0.00M | -0.07M | -0.26M | -1.08M | -0.03M |
| Net borrowings | - | 1.66M | 0.00M | - | - |
| Total cash from financing activities | 0.18M | 1.87M | 0.46M | 6.10M | 0.70M |
| Net income | -0.10M | -2.78M | -3.73M | -4.03M | -1.84M |
| Change in cash | 0.02M | -0.01M | -2.16M | 4.72M | 0.00M |
| Begin period cash flow | 0.08M | 2.62M | 4.78M | 0.07M | 0.07M |
| End period cash flow | 0.10M | 2.61M | 2.62M | 4.78M | 0.07M |
| Total cash from operating activities | -0.18M | -2.13M | -2.96M | -0.74M | -0.47M |
| Issuance of capital stock | - | 0.00M | 1.01M | 6.10M | 0.70M |
| Depreciation | 0.01M | 0.40M | 0.37M | 0.13M | 0.06M |
| Other cashflows from investing activities | - | - | -0.00M | -0.39M | - |
| Change to account receivables | - | 0.05M | 0.02M | 0.00M | 0.00M |
| Other cashflows from financing activities | - | 0.21M | -0.55M | - | - |
| Capital expenditures | 0.00M | 0.07M | 0.21M | 1.31M | 0.03M |
| Change in working capital | -0.09M | 0.26M | 0.25M | 1.50M | 1.31M |
| Other non cash items | 2915.05M | -0.05M | 0.15M | 1.66M | -0.00M |
| Free cash flow | -0.18M | -2.20M | -3.18M | -2.05M | -0.50M |
Sector: Healthcare Industry: Diagnostics & Research
|
Stock Name
|
Change
(USD) |
Price
(USD) |
Trailing
PE (x) |
Forward
PE (x) |
Price Sales
TTM (x) |
Price to Book Value (x)
|
|---|---|---|---|---|---|---|
| ADVB Advanced Biomed Inc. Common Stock |
-0.20 9.52% |
1.90 | 2.02 | - | - | 1.38 |
| TMO Thermo Fisher Scientific Inc |
-29.22 4.14% |
676.94 | 34.71 | 23.87 | 4.62 | 4.43 |
| DHR Danaher Corporation |
-8.59 3.66% |
226.34 | 29.09 | 28.01 | 5.67 | 3.20 |
| WUXIF WuXi AppTec Co. Ltd |
- -% |
26.96 | 22.29 | 17.95 | 1.53 | 5.98 |
| WUXAY WuXi AppTec Co. Ltd |
0.44 1.75% |
25.55 | 23.28 | 18.73 | 1.51 | 6.24 |
Advanced Biomed Inc., an investment holding company, engages in the research and development of microfluidic biochip technologies for precision oncology detection, diagnosis, and treatment in Taiwan. Its devices include A+Pre, an automated sample preparation system that enables pre-concentration of diluted blood samples; AC-1000, a rare cell device to solve the problem of detection of hypercoagulable state samples of tumor patients; A+SCDrop, a circulating tumor cell (CTC) single-cell capture device; and A+CellScan, an analyzer with an immunostaining chip for immunostaining/analysis of the AC-1000 product. The company also offers microfluidic biochips, such as A+Pre, AC-1000 CTC enrichment, and A+CellScan chips to provide assay products and services to cancer patients. In addition, its immunochromogenic kits include A+CTCE kit to identify epithelial circulating tumor cells and determined by the immunochromogenicity of EpCAM, CK (pan), CD45, and CD14 antibodies; A+CTCM kit to identify mesenchymal circulating tumor cells based on the immunochromogenicity of Vimentin, CD45, and CD14 antibodies; A+EMT to identify epithelial-to-mesenchymal circulating tumor cells determined by the immunochromogenicity of cell-surface Vimentin, and CD45 and CD14 antibodies; and A+CM to identify tumor-associated macrophages based on the immunochromogenicity of PD-L1, CD45, and CD14 antibodies. Further, the company is developing A+LCGuard for early screening of lung cancer. Additionally, it establishes and operates medical clinics in the People's Republic of China. The company was founded in 2014 and is headquartered in New York, New York.
| Name | Title | Year Born |
|---|---|---|
| Dr. Yi Lu Ph.D. | CEO & Chairman | 1965 |
| Mr. Mingze Yin | CFO & Director | 1990 |
| - Alan | Director of Investor Relations | NA |
| Dr. Hung To Pau Ph.D. | Secretary | 1974 |
| Mr. Mingze Yin | CFO & Director | 1989 |
| Mr. Xiaomin Chen Ph.D. | CEO & Chairman | 1977 |
Disclaimer - (*)This information, including any data, is sourced from Unicorn Data Services SAS, trading as EOD Historical Data (“EODHD”) on an ‘as is’ basis, using their API. We cannot guarantee the completeness or validity of the information and data provided on this page, as well as via the API. In some cases, the data may include analyst ratings or recommendations sourced through the EODHD API, which are intended solely for general information purposes.
This information does not consider your personal objectives, financial situation, or needs. Kalkine is not liable for any errors or omissions in the information provided or for any actions taken in reliance on it. You should seek advice from a financial adviser, stockbroker or other professional adviser (including taxation and legal advice) as necessary before acting on this information.

Download a free report with stock ideas and industry insights for general information.
Download Free Report Now →


Basic Materials
 -1.55%
Communication Services
-0.77%

Consumer Cyclical
-1.05%

Consumer Defensive
-0.33%

Energy
-2.55%

Financial Services
-1.62%
Financials
-0.80%

Healthcare
-2.85%

Industrials
-2.47%

Real Estate
-0.85%

Technology
-5.38%

Utilities
-0.83%
Note: Daily price change (%) by sector excluding stocks with +/-90% daily price change. Companies above $500 million market capitalization are considered.
 Portfolio
 Watchlist


 +31.04%
 Please wait processing your request...