 CA
 NZ
 UK
 AU
 IND

 US


…
Makita Corporation engages in the production and sales of electric power tools, pneumatic tools, and gardening and household equipment in Japan, Europe, North America, Asia, Central and South America, Oceania, The Middle East, and Africa. The company offers construction and building tools, such as cordless impact driver, cordless circular saw, cordless belt sander, cordless multi tool, cordless impact wrench, and cordless framing nailer. It also provides gardening tools, including cordless pruning saw, cordless pole hedge trimmer, cordless edger, cordless blower, cordless scarifier, and cordless pole saw. In addition, the company offers cleaning tools, including cordless vacuum sweeper, cordless cleaner, cordless pressure washer, cordless polisher scrubber, as well as cordless cooler & warmer box, cordless job site speaker, and cordless bar light. Further, it provides parts, repairs, and accessories. The company was formerly known as Makita Electric Works, Ltd. and changed its name to Makita Corporation in April 1991. Makita Corporation was founded in 1915 and is headquartered in Anjo, Japan.
Source: TradingView
The charts and visual representations are sourced from TradingView through embedded widgets. For any issues with chart display, please visit the TradingView website
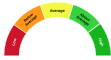
A unique technical analysis driven score developed by Kalkine showing momentum in stock prices based on select technical indicators identified.
Makita Corporation manufactures power tools, outdoor equipment and accessories for professional and consumer markets worldwide. Long-term growth may be driven by tool electrification, wider adoption of lithium-ion platforms, aftermarket replacement demand and geographic expansion. The company appears positioned with a well-known brand, broad product range and recurring accessory sales.
Key risks include cyclicality in construction and consumer spending, strong competition from global toolmakers, currency and commodity volatility, and supply-chain disruptions.

Note: The summary and risk score provided above is created by AI and should not be construed as a recommendation of Kalkine.


| Breakdown | 2026-03-31 | 2025-03-31 | 2024-03-31 | 2023-03-31 | 2022-03-31 |
|---|---|---|---|---|---|
| Type | yearly | yearly | yearly | yearly | yearly |
| Date | 2026-03-31 | 2025-03-31 | 2024-03-31 | 2023-03-31 | 2022-03-31 |
| Income before tax | 114531.27M | 108477.00M | 64017.00M | 23887.00M | 92483.00M |
| Minority interest | -24.00M | 135.00M | 76.00M | 134.00M | -567.00M |
| Net income | 84203.29M | 79338.00M | 43691.00M | 11705.00M | 64770.00M |
| Selling general administrative | 179266.00M | 164388.00M | 157776.00M | 160502.00M | 136590.00M |
| Selling and marketing expenses | - | - | 12879.00M | - | - |
| Gross profit | 301095.62M | 271426.00M | 223945.00M | 188748.00M | 228318.00M |
| Reconciled depreciation | 30465.00M | 29757.00M | 28925.00M | 25889.00M | 21002.00M |
| Ebit | 111018.47M | 114488.00M | 70812.00M | 31562.00M | 93665.00M |
| Ebitda | 143320.75M | 144245.00M | 99737.00M | 57451.00M | 114667.00M |
| Depreciation and amortization | 32302.28M | 29757.00M | 28925.00M | 25889.00M | 21002.00M |
| Operating income | 111018.47M | 107038.00M | 66169.00M | 28246.00M | 91728.00M |
| Other operating expenses | 713476.91M | 646092.00M | 675222.00M | 736456.00M | 647532.00M |
| Interest expense | 3800.14M | 6011.00M | 6795.00M | 7675.00M | 1182.00M |
| Tax provision | 28579.00M | 29274.00M | 20402.00M | 12316.00M | 27146.00M |
| Interest income | 6896.00M | 7450.00M | 4643.00M | 3316.00M | 1937.00M |
| Net interest income | 3312.00M | 1439.00M | -2152.00M | -4359.00M | 755.00M |
| Income tax expense | 30302.54M | 29274.00M | 20402.00M | 12316.00M | 27146.00M |
| Total revenue | 824495.38M | 753130.00M | 741391.00M | 764702.00M | 739260.00M |
| Total operating expenses | 190077.15M | 164388.00M | 157776.00M | 160502.00M | 136590.00M |
| Cost of revenue | 523399.76M | 481704.00M | 517446.00M | 575954.00M | 510942.00M |
| Total other income expense net | 3512.80M | 1439.00M | -2152.00M | -4359.00M | 755.00M |
| Net income from continuing ops | 79438.00M | 79203.00M | 43615.00M | 11571.00M | 65337.00M |
| Net income applicable to common shares | - | - | - | 11705.00M | 64770.00M |
| Breakdown | 2026-03-31 | 2025-03-31 | 2024-03-31 | 2023-03-31 | 2022-03-31 |
|---|---|---|---|---|---|
| Type | yearly | yearly | yearly | yearly | yearly |
| Date | 2026-03-31 | 2025-03-31 | 2024-03-31 | 2023-03-31 | 2022-03-31 |
| Total assets | 1186308.00M | 1106525.00M | 1055808.00M | 1099351.00M | 1007497.00M |
| Intangible assets | 8936.59M | 8853.00M | 9485.00M | 9706.00M | 9364.00M |
| Other current assets | 54306.02M | 19551.00M | 16671.00M | 19113.00M | 15952.00M |
| Total liab | 177409.13M | 174029.00M | 180602.00M | 323652.00M | 254967.00M |
| Total stockholder equity | 1001665.63M | 926006.00M | 868156.00M | 769247.00M | 746344.00M |
| Other current liab | 81590.34M | 61215.00M | 66484.00M | 47552.00M | 48181.00M |
| Common stock | 23908.25M | 23805.00M | 23805.00M | 23805.00M | 23805.00M |
| Capital stock | 23805.00M | 23805.00M | 23805.00M | 23805.00M | 23805.00M |
| Retained earnings | 782868.77M | 732556.00M | 669359.00M | 629314.00M | 640577.00M |
| Other liab | - | - | - | 32059.00M | 30802.00M |
| Good will | 724.13M | 721.00M | 721.00M | 721.00M | 721.00M |
| Other assets | - | - | - | 17901.00M | 12238.00M |
| Cash | 258501.32M | 253279.00M | 196645.00M | 162720.00M | 71057.00M |
| Total current liabilities | 139582.78M | 138998.00M | 145475.00M | 291593.00M | 224165.00M |
| Current deferred revenue | - | - | 613.00M | 15884.00M | 29036.00M |
| Net debt | -256106.98M | -243127.00M | -176754.00M | 23670.00M | 8617.00M |
| Short term debt | 2394.34M | 10152.00M | 19891.00M | 186390.00M | 79674.00M |
| Short long term debt | 2384.00M | 10152.00M | 19891.00M | 186390.00M | 79674.00M |
| Short long term debt total | 2394.34M | 10152.00M | 19891.00M | 186390.00M | 79674.00M |
| Other stockholder equity | -31430.73M | 169645.00M | 24106.00M | -653119.00M | -664382.00M |
| Property plant equipment | - | - | - | 265638.00M | 243636.00M |
| Total current assets | 811697.26M | 756437.00M | 693635.00M | 753439.00M | 684959.00M |
| Net tangible assets | - | - | - | - | 736259.00M |
| Short term investments | 93874.39M | 39660.00M | 18561.00M | 6970.00M | 5281.00M |
| Net receivables | 122547.21M | 105831.00M | 116267.00M | 110884.00M | 117541.00M |
| Inventory | 377459.03M | 338116.00M | 345491.00M | 453752.00M | 475128.00M |
| Accounts payable | 55598.10M | 54628.00M | 49987.00M | 41767.00M | 67274.00M |
| Accumulated other comprehensive income | 226319.35M | - | 150886.00M | - | - |
| Non currrent assets other | 18821.28M | 55782.00M | 55049.00M | 22309.00M | 20315.00M |
| Non current assets total | 374610.73M | 350088.00M | 362173.00M | 345912.00M | 322538.00M |
| Breakdown | 2026-03-31 | 2025-03-31 | 2024-03-31 | 2023-03-31 | 2022-03-31 |
|---|---|---|---|---|---|
| Type | yearly | yearly | yearly | yearly | yearly |
| Date | 2026-03-31 | 2025-03-31 | 2024-03-31 | 2023-03-31 | 2022-03-31 |
| Investments | 5552.00M | -37872.00M | -25619.00M | -37680.00M | 31006.00M |
| Change to liabilities | - | - | - | 0.00M | 1295.00M |
| Total cashflows from investing activities | -18697.47M | -37872.00M | -25619.00M | - | -27891.00M |
| Net borrowings | -8586.00M | -9718.00M | -171379.00M | 104874.00M | 75169.00M |
| Total cash from financing activities | -105147.55M | -33545.00M | -191277.00M | 80970.00M | 52626.00M |
| Change to operating activities | - | - | - | 180.00M | 25499.00M |
| Net income | 84203.29M | 79203.00M | 43615.00M | 11571.00M | 65337.00M |
| Change in cash | 87352.73M | 56634.00M | 33925.00M | 91663.00M | -77583.00M |
| Begin period cash flow | 171148.59M | 196645.00M | 162720.00M | 71057.00M | 148640.00M |
| End period cash flow | 258501.32M | 253279.00M | 196645.00M | 162720.00M | 71057.00M |
| Total cash from operating activities | 108507.66M | 129874.00M | 237086.00M | 44430.00M | -103660.00M |
| Depreciation | 32302.28M | 29757.00M | 28925.00M | 25889.00M | 21002.00M |
| Other cashflows from investing activities | -2792.85M | -15723.00M | 1232.00M | 925.00M | 315.00M |
| Dividends paid | 31283.32M | 18025.00M | 5677.00M | -19550.00M | -18736.00M |
| Change to inventory | -2857.53M | 4112.00M | 151378.00M | 48571.00M | -175557.00M |
| Change to account receivables | -5898.49M | 8792.00M | 4940.00M | 12488.00M | -14153.00M |
| Sale purchase of stock | -59300.90M | -3.00M | -10002.00M | -1.00M | -7.00M |
| Other cashflows from financing activities | -5459.52M | -5799.00M | -4219.00M | 100521.00M | 71369.00M |
| Change to netincome | - | - | - | -27114.00M | -27083.00M |
| Capital expenditures | 22830.55M | 17594.00M | 17851.00M | 39088.00M | 59937.00M |
| Change in working capital | -8792.07M | 20221.00M | 163955.00M | 39700.00M | -199249.00M |
| Other non cash items | 794.17M | 693.00M | 591.00M | -32730.00M | 9250.00M |
| Free cash flow | 85677.12M | 129874.00M | 219235.00M | 5342.00M | -163597.00M |
Sector: Industrials Industry: Tools & Accessories
|
Stock Name
|
Change
(USD) |
Price
(USD) |
Trailing
PE (x) |
Forward
PE (x) |
Price Sales
TTM (x) |
Price to Book Value (x)
|
Enterprise Value
to Revenue (x) |
Enterprise Value
to EBITDA (x) |
|---|---|---|---|---|---|---|---|---|
| MKTAY Makita Corp |
0.14 0.40% |
34.96 | 17.25 | 16.31 | 0.01 | 1.32 | 1.38 | 7.53 |
| TTNDY Techtronic Industries Ltd ADR |
-0.99 1.11% |
88.58 | 22.36 | 17.42 | 1.66 | 3.79 | 1.85 | 14.10 |
| TTNDF Techtronic Industries Company Limited |
- -% |
17.95 | 22.09 | 17.86 | 1.68 | 3.77 | 1.85 | 14.10 |
| SNA Snap-On Inc |
-1.97 0.54% |
363.02 | 19.11 | 17.61 | 3.68 | 3.23 | 3.64 | 12.75 |
| RBC RBC Bearings Incorporated |
-5.30 1.10% |
476.78 | 47.38 | 35.34 | 7.84 | 4.38 | 8.14 | 26.88 |
Makita Corporation engages in the production and sales of electric power tools, pneumatic tools, and gardening and household equipment in Japan, Europe, North America, Asia, Central and South America, Oceania, The Middle East, and Africa. The company offers construction and building tools, such as cordless impact driver, cordless circular saw, cordless belt sander, cordless multi tool, cordless impact wrench, and cordless framing nailer. It also provides gardening tools, including cordless pruning saw, cordless pole hedge trimmer, cordless edger, cordless blower, cordless scarifier, and cordless pole saw. In addition, the company offers cleaning tools, including cordless vacuum sweeper, cordless cleaner, cordless pressure washer, cordless polisher scrubber, as well as cordless cooler & warmer box, cordless job site speaker, and cordless bar light. Further, it provides parts, repairs, and accessories. The company was formerly known as Makita Electric Works, Ltd. and changed its name to Makita Corporation in April 1991. Makita Corporation was founded in 1915 and is headquartered in Anjo, Japan.
| Name | Title | Year Born |
|---|---|---|
| Mr. Munetoshi Goto | Pres & Representative Director | NA |
| Mr. Shinichiro Tomita | Corp. Officer, GM of Purchasing Headquarters & Director | 1951 |
| Mr. Tetsuhisa Kaneko | Corp. Officer, GM of R&D Headquarters and Director | 1955 |
| Mr. Tomoyuki Ota | Corp. Officer, Assistant GM of R&D Headquarters and Director | NA |
| Takashi Omote | Corp. Officer, GM of International Sales Headquarters & Director | NA |
| Takashi Tsuchiya | Corp. Officer, GM of Domestic Sales Marketing Headquarters & Director | NA |
| Masaki Yoshida | Corp. Officer, Assistant GM of Production Headquarters & Director | NA |
| Tomoharu Yasuda | Corp. Officer and Assistant GM of Domestic Sales & Marketing Headquarters for Tokyo Area | NA |
| Shinichi Sakamoto | Corp. Officer & In charge of Asia Sales | NA |
| Hideki Shimazoe | Corp. Officer & Assistant GM of Domestic Sales Marketing Headquarters - Nagoya Area | NA |
Disclaimer - (*)This information, including any data, is sourced from Unicorn Data Services SAS, trading as EOD Historical Data (“EODHD”) on an ‘as is’ basis, using their API. We cannot guarantee the completeness or validity of the information and data provided on this page, as well as via the API. In some cases, the data may include analyst ratings or recommendations sourced through the EODHD API, which are intended solely for general information purposes.
This information does not consider your personal objectives, financial situation, or needs. Kalkine is not liable for any errors or omissions in the information provided or for any actions taken in reliance on it. You should seek advice from a financial adviser, stockbroker or other professional adviser (including taxation and legal advice) as necessary before acting on this information.

Download a free report with stock ideas and industry insights for general information.
Download Free Report Now →


Basic Materials
 -0.11%
Communication Services
-0.43%

Consumer Cyclical
-0.29%

Consumer Defensive
-0.12%

Energy
-0.37%

Financial Services
-0.66%
Financials
 +0.37%

Healthcare
-0.58%

Industrials
-0.46%

Real Estate
-0.32%

Technology
-1.28%

Utilities
-0.40%
Note: Daily price change (%) by sector excluding stocks with +/-90% daily price change. Companies above $500 million market capitalization are considered.
 Portfolio
 Watchlist


 Please wait processing your request...