
 CA
 NZ
 UK
 AU
 IND

 US

 Share
 X (Formerly Twitter)
 Whatsapp
 Facebook
 LinkedIn
 Telegram
 Email This Article
 Copy Link
 Summarize with AI
 Chat GPT
 Perplexity

FIGS Inc. (NYSE: FIGS) is consolidating just below its session peak after completing a multi-week technical expansion to test fresh multi-month highs. As of this chart snapshot (intraday trading on October 14, 2026), shares are trading at $17.99, down $0.01 (-0.06%). The stock opened at $17.89, pushed to an intraday session high of $18.10, and defended a low of $17.46. The modest intraday pause follows a steep rally from the mid-September base near $12.00, pushing price directly into major overhead Supply dating back to March 2026. With no single-session company filing evident on the immediate print, the technical case centers on dynamic breakout momentum and resistance digestion. 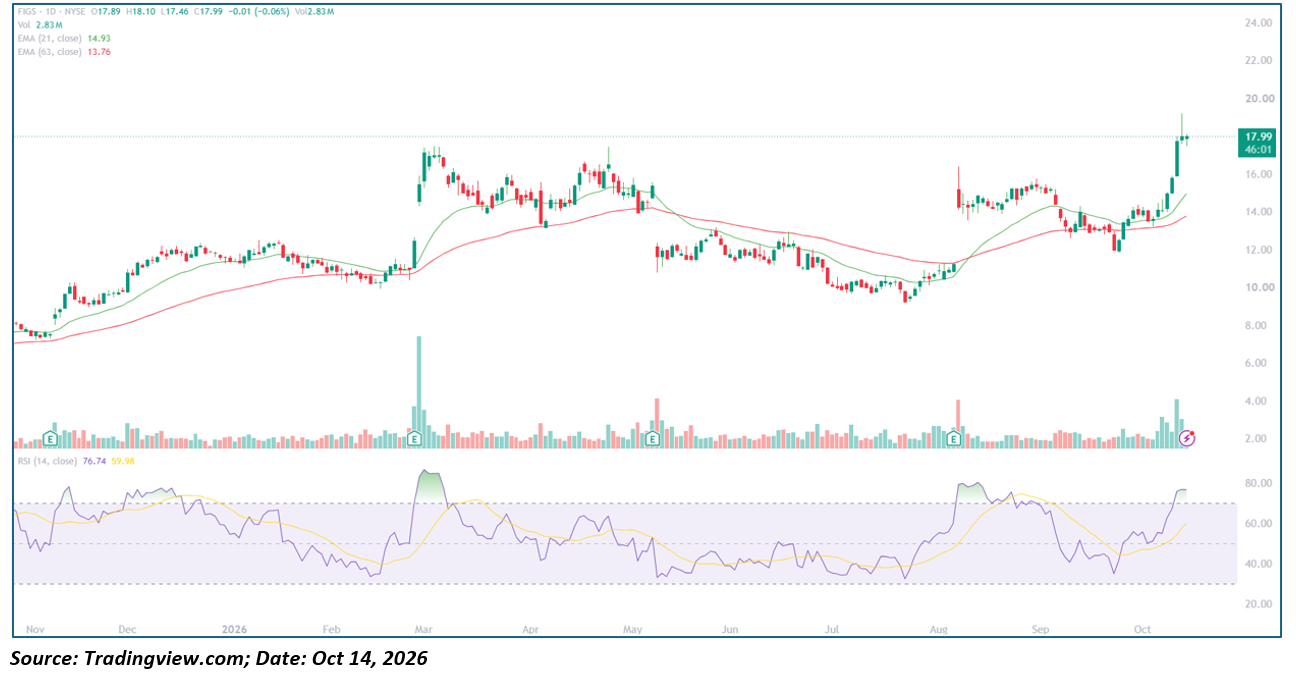
Key Highlights
- Trading at $17.99, down $0.01 (-0.06%), on partial-session Volume of 2.83M shares.
- Opened at $17.89, reaching an intraday high of $18.10 and a session low of $17.46.
- 21-day EMA at $14.93 and 63-day EMA at $13.76, both trending upward beneath price in a bullish golden-cross stack.
- 14-day RSI at 76.74, positioned well above its 59.98 signal line and entering an extended overbought zone (>70).
- Resistance at $18.10 (intraday high), ~$18.50, and ~$19.50 (upper wick spike); support at $17.46 (session low), $16.50 (prior breakout ceiling), and $14.93 (21-day EMA).
Trend Structure: Three-Act Pattern
- Advance, March Earnings Spike, and Distribution (November 2025 – May 2026):
FIGS climbed steadily from a low near $7.50 in November 2025 to roughly $12.00 by January 2026. In late February/early March, a heavy-volume earnings gap surged shares toward $17.50, pushing the 14-day RSI into the mid-80s. The stock subsequently distributed in a wide $14.50–$17.50 range before a sharp May earnings gap-down broke structure and initiated a downtrend toward $11.00.
- Base Building and Summer Consolidation (June – August 2026):
The stock carved out a macro double-bottom floor near $9.50–$10.00 between June and July 2026, with RSI tracking quietly in the sub-40 range. In August, a post-earnings volume expansion lifted the stock back through the 21-day and 63-day EMAs to test $15.50, re-establishing an accumulation base above $12.00.
- Breakout and Momentum Surge (September – October 2026):
After pulling back to test dynamic support at the 63-day EMA ($12.00–$12.50) in mid-September, FIGS ignited a vertical impulse leg. Consecutive bullish daily candles drove the price from $13.00 to an intraday high of $18.10 in October, breaking above the March highs and lifting the asset more than 80% from its summer lows.
Backdrop
The chart reflects quarterly earnings markers in late February/early March, May, and August. The fourth earnings ICON ("E") sits right at the onset of the current October expansion, indicating either recent quarterly commentary or an imminent report date that traders must verify. Historic earnings prints for FIGS have sparked outsized Volatility (gaps up in March and August, gap down in May), making risk management around event windows critical.
Moving Averages and Momentum Profile
- Moving Average Stack: The 21-day EMA ($14.93) has crossed decisively above the 63-day EMA ($13.76), with both dynamic lines sloping upward. Price trades roughly 20.5% above the 21-day EMA, highlighting an extended trend that may require near-term mean-reversion or time consolidation.
- Oscillator Behavior: The 14-day RSI sits at 76.74, tracking comfortably above its 59.98 signal line. This marks the first entry into overbought territory (>70) since the March run, reflecting powerful upside conviction but warning of short-term exhaustion if buying volume tapers.
- Volume Behavior: Turnout stands at 2.83M shares on an incomplete session, matching the recent expansion in daily volume. While healthy, absorbing heavy historical supply near $18.50–$19.50 will require volume to approach the 4.0M+ spikes seen during prior breakout phases.
Key Technical Levels
|
Level |
Type |
Note |
|---|---|---|
|
~$19.50 |
Resistance |
Upper wick spike resistance from November 2025 macro cycle |
|
~$18.50 |
Resistance |
Late-March 2026 swing peak and major structural supply zone |
|
$18.10 |
Resistance |
Current session peak and immediate overhead ceiling |
|
$17.99 |
Reference |
Current market price |
|
$17.46 |
Support |
Current session low |
|
~$16.50 |
Support |
Prior horizontal resistance shelf and breakout retest target |
|
$14.93 |
Support |
Dynamic 21-day EMA |
|
$13.76 |
Support |
Dynamic 63-day EMA |
|
~$12.00 |
Support |
September swing-low base and macro structural demand |
Actionable Technical Outlook
- A decisive daily close above $18.10–$18.50 on strong turnover would clear the March 2026 supply zone, unlocking a technical runway toward the multi-quarter high near $19.50.
- Intermediate bullish market structure remains fully intact as long as price holds above the previous breakout platform near $16.50 and the rising 21-day EMA ($14.93).
- With the 14-day RSI entering overbought territory at 76.74, an intraday digestion phase or test of the $17.46 low is typical before attempting the next leg higher.
Metadata
|
Field |
Value |
|---|---|
|
Headline |
Why is FIGS (NYSE: FIGS) Consolidating at $17.99 After a Multi-Month High, and Can It Clear $18.50? |
|
SEO title |
FIGS Stock Analysis: Overbought RSI, EMA Support, and $18.50 Breakout Level |
|
Meta description |
FIGS Inc. trades near $17.99 after an 80% rebound off summer lows. Technical breakdown covering the 21-day EMA, 76 RSI, and key resistance targets. |
|
Slug |
why-figs-stock-consolidating-at-17-99-rsi-overbought-18-50-level |
|
Tags |
FIGS, NYSE, apparel, technical analysis, moving averages, relative strength index, earnings |
|
Ticker / Sector |
FIGS / Consumer Discretionary |
|
Verification status |
PARTIAL (levels extracted directly from TradingView chart; next earnings date requires company verification) |
|
Data as-of date |
October 14, 2026 (intraday trading session) |


 Nov 12, 2026





 Please wait processing your request...