
 CA
 NZ
 UK
 AU
 IND

 US

 Share
 X (Formerly Twitter)
 Whatsapp
 Facebook
 LinkedIn
 Telegram
 Email This Article
 Copy Link
 Summarize with AI
 Chat GPT
 Perplexity

Solaris Energy Infrastructure, Inc. (NASDAQ: SLSN) is attempting to stabilize near the $0.90 level after an extended decline, but the broader technical structure remains weak. As of the October 15, 2026, Daily Chart snapshot, shares are trading at $0.9070, down $0.0830 (-8.38%) on the latest candle. The stock opened at $0.9700, reached a high of $0.9700 and a low of $0.9070. Price is marginally above the 21-day EMA at $0.8779 but remains just below the 63-day EMA at $0.9084. This places SLSN at a key technical inflection point: holding above the 21-day EMA could support a short-term recovery, while reclaiming the 63-day EMA is necessary to strengthen the bullish case. RSI at 53.70 has slipped below its signal line at 50.42 after a recent spike, indicating that momentum has cooled despite the earlier attempt to break higher. 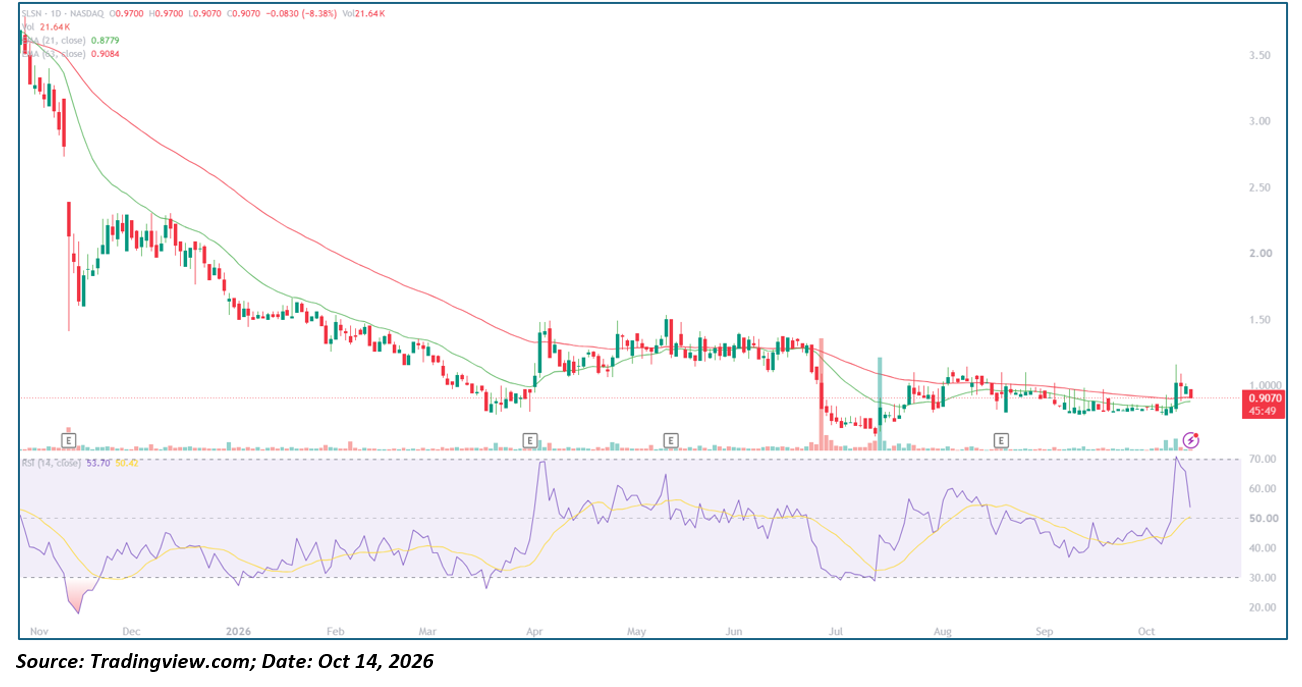
Key Highlights
- Trading at $0.9070, down $0.0830 (-8.38%) on the latest daily candle.
- Opened at $0.9700, reached a high of $0.9700 and a low of $0.9070.
- 21-day EMA: $0.8779; 63-day EMA: $0.9084 — price is above the shorter average but marginally below the longer one.
- 14-day RSI: 53.70, compared with its signal line at 50.42, indicating positive but weakening momentum.
- Immediate resistance lies around $0.97–$1.00, followed by the $1.10–$1.20 region.
- Initial support is around $0.90, followed by $0.88 and the $0.80–$0.85 area.
Trend Structure: Three-Act Pattern
1. Extended Decline and Lower Highs (November 2025–March 2026): SLSN experienced a prolonged downtrend, falling from approximately $3.50 in November 2025 toward the $0.80–$1.00 region by March 2026. The stock consistently formed lower highs and lower lows, while the 21-day EMA remained below the 63-day EMA for much of the decline. RSI frequently traded below 50, reflecting persistent selling pressure. The move established a weak long-term technical structure.
2. Relief Rally and Range Formation (April–June 2026): The stock rebounded sharply in early April, briefly moving toward $1.50 on a significant increase in volume. However, the recovery failed to establish a sustained uptrend, and price settled into a broad range around $1.20–$1.45. The moving averages began to converge, indicating a temporary reduction in directional momentum. A sharp decline in late June subsequently pushed SLSN below $1.00, reversing much of the earlier recovery.
3. Stabilization and Attempted Recovery (July–October 2026): After falling toward the $0.75–$0.85 region in July, SLSN rebounded toward $1.00–$1.10 in August before entering another period of consolidation. Throughout September, price mostly traded around $0.85–$0.95, with the moving averages flattening. In October, the stock attempted a sharp move higher, briefly approaching $1.10, but the advance was rejected. The latest candle has pulled price back to $0.9070, leaving it just below the 63-day EMA and indicating that the breakout attempt has not yet been confirmed.
Backdrop
The chart shows a prolonged decline followed by several unsuccessful recovery attempts. The sharp Volume spikes during April, late June and July coincided with significant price movements, while trading activity was comparatively subdued during much of the September consolidation.
The recent October move briefly pushed the stock higher but failed to hold its gains. This suggests that selling pressure remains present near the $1.00–$1.10 region. The chart alone does not establish the fundamental reason behind the latest price decline or recovery attempt. Company announcements, earnings, financing developments and sector-specific news should be checked separately before attributing the price action to a particular catalyst.
Moving Averages and Momentum Profile
- Price Structure: SLSN has fallen substantially from its November 2025 highs and remains well below its historical peak. The latest decline has brought price back toward $0.90 after an unsuccessful October rally. Holding the $0.90 area would help stabilize the short-term structure, while a sustained move above $0.97–$1.00 would provide stronger evidence of renewed buying interest.
- Moving Average Structure: The 21-day EMA at $0.8779 is below the 63-day EMA at $0.9084. Although price remains above the shorter average, it is marginally below the longer one. This is a mixed technical signal: the shorter-term recovery remains intact, but the intermediate trend has yet to turn decisively bullish. A sustained move above both averages would strengthen the recovery case.
- Oscillator Behaviour: The RSI stands at 53.70, above the neutral 50 threshold but below its signal line at 50.42 only if momentum readings subsequently reverse; in the supplied snapshot, RSI is actually above the signal line. The latest RSI has fallen sharply from its recent spike, indicating that bullish momentum has cooled. A return toward 60–70 alongside a price breakout would support renewed upside momentum, while a move below 50 would indicate weakening buying pressure.
- Volume Behaviour: The latest candle shows volume of approximately 21.64K shares. The chart displays much larger volume spikes during earlier sharp price movements, but the latest pullback does not show comparable activity. A recovery above $1.00 accompanied by expanding volume would offer stronger confirmation than a low-volume advance.
Key Technical Levels
|
Level |
Type |
Note |
|
$1.20–$1.30 |
Resistance |
Previous consolidation and recovery zone |
|
$1.10 |
Resistance |
Recent October rally high area |
|
$1.00 |
Resistance |
Psychological round-number level |
|
$0.97 |
Resistance |
Latest candle's opening price and high |
|
$0.9084 |
Resistance |
63-day EMA |
|
$0.9070 |
Reference |
Latest chart price |
|
$0.90 |
Support |
Immediate psychological and price reference |
|
$0.8779 |
Support |
21-day EMA |
|
$0.85 |
Support |
Recent consolidation region |
|
$0.80 |
Support |
Lower end of the recent trading range |
|
$0.75 |
Major support |
Approximate July swing-low region |
Historical levels are approximate readings from the supplied daily chart. The October swing high and lower support areas should be checked against exact chart values before publication.
Actionable Technical Outlook
- Bullish Scenario: A sustained recovery above the 63-day EMA at $0.9084, followed by a breakout above $0.97–$1.00, would improve the technical outlook. A confirmed move above $1.00 with stronger volume could open the way toward $1.10 and potentially $1.20.
- Neutral Scenario: If SLSN continues trading between $0.88 and $0.97, the stock may remain in a consolidation phase. Traders would need a decisive breakout or breakdown to establish a clearer directional bias.
- Bearish Scenario: A sustained move below the 21-day EMA at $0.8779 would weaken the short-term recovery. A break below $0.85 could expose the $0.80 region, followed by the approximate July low near $0.75.
- Momentum Confirmation: The bullish case would strengthen if RSI remains above 50, price reclaims both moving averages and volume expands during advances. A move below $0.88 accompanied by weakening RSI would suggest that sellers are regaining control.
The immediate technical question is whether SLSN can reclaim its 63-day EMA and recover above $0.97–$1.00. The stock is attempting to stabilize, but the longer-term decline and failed October rally mean that confirmation is still needed before treating the move as a sustained trend reversal.
Metadata
|
Field |
Value |
|
Headline |
Why Is Solaris Energy Infrastructure (NASDAQ: SLSN) Struggling Below $1, and Can It Reclaim Its 63-Day EMA? |
|
SEO Title |
SLSN Stock Analysis: $1 Resistance, RSI and Key EMA Levels |
|
Meta Description |
Solaris Energy Infrastructure (NASDAQ: SLSN) trades near $0.91 as price tests its 21-day and 63-day EMAs. Explore key support, resistance and the outlook for a recovery above $1. |
|
Slug |
solaris-energy-infrastructure-slsn-stock-analysis-1-dollar-resistance |
|
Tags |
Solaris Energy Infrastructure, SLSN, NASDAQ, technical analysis, RSI, moving averages, penny stocks |
|
Ticker / Sector |
SLSN / Energy |
|
Verification Status |
Chart-based analysis; company-specific catalyst and 52-week range not independently verified |
|
Data As Of |
October 15, 2026, approximately 00:44 IST, based on the supplied TradingView chart |
Note: This analysis is based on the supplied daily chart. Technical levels are indicative rather than guaranteed price targets, and the article does not constitute personalized Investment advice.


 Nov 13, 2026





 Please wait processing your request...