
 CA
 NZ
 UK
 AU
 IND

 US

 Share
 X (Formerly Twitter)
 Whatsapp
 Facebook
 LinkedIn
 Telegram
 Email This Article
 Copy Link
 Summarize with AI
 Chat GPT
 Perplexity

Vera Bradley, Inc. (NASDAQ: VRA) is showing strong bullish momentum after breaking above its multi-month trading range, with shares trading at $5.63 on the latest daily chart. The stock is down $0.15 (-2.51%) on the current candle after opening at $5.70, reaching a high of $5.80 and a low of $5.50. Despite the daily pullback, the broader trend remains constructive, with price well above the 21-day EMA at $4.76 and the 63-day EMA at $4.09. The 21-day EMA is also positioned above the 63-day EMA, supporting the bullish trend structure. However, the 14-day RSI stands at 75.32, above its signal line at 72.11 and firmly in overbought territory. The immediate question is whether VRA can hold above $5.50 and push through the $5.80–$6.00 resistance zone, or whether the sharp rally will trigger near-term profit-taking. 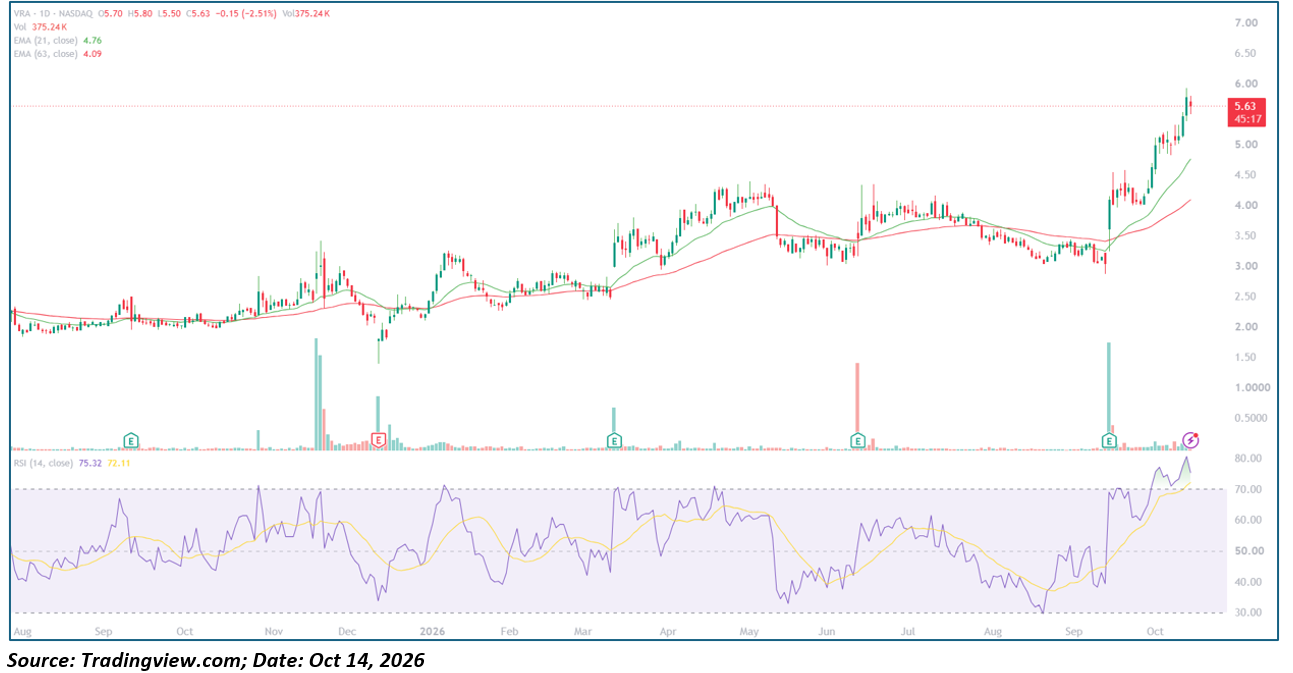
Key Highlights
- Trading at $5.63, down $0.15 (-2.51%) on the latest daily candle.
- Opened at $5.70, reached an intraday high of $5.80 and a low of $5.50.
- 21-day EMA: $4.76; 63-day EMA: $4.09 — price remains above both moving averages.
- 14-day RSI: 75.32, compared with its signal line at 72.11, indicating strong but overbought momentum.
- Immediate resistance stands at $5.80–$6.00, followed by the $6.50–$7.00 region.
- Initial support is around $5.50, followed by $5.00, the 21-day EMA at $4.76 and the 63-day EMA at $4.09.
Trend Structure: Three-Act Pattern
1. Base Formation and Early Volatility (August–December 2025): VRA traded mainly between approximately $1.90 and $2.40 during the early part of the period. A sharp advance in November pushed the stock toward $3.00–$3.30, accompanied by a significant increase in trading volume. The rally subsequently reversed, and the stock retreated toward the $2.00–$2.50 range by December. This period established a volatile base, with occasional Volume spikes suggesting abrupt changes in trading interest.
2. Gradual Recovery and Range Expansion (January–August 2026): VRA recovered toward $3.00 in January before advancing toward $4.00–$4.30 in April. The stock encountered resistance around this area and subsequently consolidated. A decline in May and June brought price back toward $3.20–$3.50, followed by a recovery toward $4.00 in June and July. However, the advance lost momentum, and VRA gradually declined toward the $3.00–$3.50 region in August and early September. During this phase, the moving averages flattened and price remained within a broad trading range.
3. Breakout and Accelerating Momentum (September–October 2026): The stock broke sharply higher in September, accompanied by a substantial volume spike. VRA moved above its previous consolidation range and continued advancing through $4.00 and $5.00. The latest rally has carried price to $5.63, with an intraday high of $5.80. The 21-day EMA has turned higher and remains above the 63-day EMA, while RSI has moved above 70. This confirms strong upside momentum but also suggests that the stock may be vulnerable to a short-term pause after its rapid advance.
Backdrop
The chart shows several historical price expansions accompanied by significant increases in trading volume, particularly during November 2025 and September 2026. The latest advance is notable because it has lifted VRA above its previous trading range and created a clear separation between the share price and both moving averages.
However, the chart alone does not establish the fundamental reason behind the latest rally. Company earnings, financial guidance, restructuring developments, retail Demand and other corporate announcements would need to be checked separately before attributing the price movement to a specific catalyst.
Moving Averages and Momentum Profile
- Breakout Dynamics: VRA has advanced above the $4.00 and $5.00 levels after consolidating around $3.00–$4.00 for several months. The latest candle shows some selling pressure, with the stock down 2.51% and trading below its intraday high of $5.80. A hold above $5.50 would help preserve the immediate breakout structure, while a sustained move above $5.80 could open the way toward $6.00.
- Moving Average Structure: The 21-day EMA at $4.76 is above the 63-day EMA at $4.09, providing a bullish moving-average alignment. The current price is approximately 18.3% above the 21-day EMA and 37.7% above the 63-day EMA. This separation confirms strong upward momentum but also indicates that price has moved considerably above its average trading levels, increasing the possibility of consolidation or a pullback.
- Oscillator Behaviour: The RSI stands at 75.32, above its signal line at 72.11 and beyond the conventional 70 overbought threshold. This reflects strong buying momentum, although the gap between RSI and its signal line is relatively narrow. If RSI begins to turn lower while price struggles near $5.80–$6.00, it could indicate that upside momentum is cooling. An overbought reading alone, however, does not guarantee a reversal.
- Volume Behaviour: The chart shows a substantial volume spike during the September breakout, supporting the significance of the move above the previous trading range. The latest candle's volume is approximately 375.24K shares. Continued volume expansion during further advances would strengthen the breakout case, while heavy selling volume could signal profit-taking.
Key Technical Levels
|
Level |
Type |
Note |
|
$7.00 |
Resistance |
Upper chart reference and potential extension zone |
|
$6.50 |
Resistance |
Potential psychological and technical hurdle |
|
$6.00 |
Resistance |
Round-number level and next major upside test |
|
$5.80 |
Resistance |
Latest candle's high |
|
$5.63 |
Reference |
Latest chart price |
|
$5.50 |
Support |
Latest candle's low |
|
$5.00 |
Support |
Psychological level and recent breakout region |
|
$4.76 |
Support |
21-day EMA |
|
$4.50 |
Support |
Intermediate chart reference |
|
$4.09 |
Support |
63-day EMA |
|
$3.50–$3.20 |
Major support |
Previous consolidation and recovery zone |
Historical levels are approximate readings from the supplied daily chart. The $6.50 and $7.00 levels are potential future resistance areas rather than confirmed recent swing highs.
Actionable Technical Outlook
- Bullish Scenario: A sustained move above $5.80 would strengthen the current breakout and put $6.00 in focus. A decisive close above $6.00, supported by strong volume, could open the way toward $6.50 and potentially $7.00.
- Consolidation Scenario: With RSI at 75.32, VRA may pause or pull back toward $5.50–$5.00 before attempting another advance. A controlled retest followed by renewed buying interest would help validate the breakout.
- Bearish Scenario: A sustained decline below $5.00 would weaken the immediate bullish structure and bring the 21-day EMA at $4.76 into focus. A deeper correction could extend toward the $4.50 area and the 63-day EMA at $4.09.
- Momentum Confirmation: The bullish outlook would improve if VRA holds above $5.00, RSI stabilizes and buying volume expands during advances. A sharp Reversal in RSI accompanied by a high-volume price breakdown would warn that the rally is losing strength.
The immediate technical question is whether VRA can hold its recent breakout and clear the $5.80–$6.00 resistance zone. The trend currently favours the bulls, but the elevated RSI and distance from the moving averages make chasing the rally riskier than waiting for a confirmed breakout or a controlled retest.
Metadata
|
Field |
Value |
|
Headline |
Why Is Vera Bradley (NASDAQ: VRA) Rallying Toward $6, and Can the Breakout Extend? |
|
SEO Title |
Vera Bradley (VRA) Stock Breakout: RSI, Moving Averages and $6 Resistance |
|
Meta Description |
Vera Bradley (NASDAQ: VRA) rallies to $5.63 above its 21-day and 63-day EMAs as RSI reaches 75.32. Explore key support, resistance and the technical outlook toward $6. |
|
Slug |
vera-bradley-vra-stock-technical-analysis-breakout-6-resistance |
|
Tags |
Vera Bradley, VRA, NASDAQ, technical analysis, RSI, moving averages, breakout stocks |
|
Ticker / Sector |
VRA / Consumer Discretionary |
|
Verification Status |
Chart-based analysis; fundamental catalyst and 52-week range not independently verified |
|
Data As Of |
October 15, 2026, approximately 00:44 IST, based on the supplied TradingView chart |
Note: This analysis is based on the supplied daily chart. Technical levels are indicative rather than guaranteed price targets, and the article does not constitute personalized Investment advice.


 Nov 10, 2026





 Please wait processing your request...