
Image Source : Krish Capital Pty Ltd
Index Update
U.S. equity futures extended losses on Wednesday as trade tensions escalated, with China retaliating against U.S. tariffs by raising duties on American goods to 84% and adding firms to its export control list. Futures tied to the S&P 500 and Dow fell over 1%, while Nasdaq 100 futures slipped 0.7%, all hitting their lowest levels in over a year. The deepening trade war between the U.S. and China dampened hopes for a resolution, especially as other Asian nations like Japan, South Korea, and Vietnam seek to reduce trade barriers.
Corporate stocks were broadly lower across sectors. Delta dropped after withdrawing its guidance amid recession fears, AbbVie declined following Trump’s threat of tariffs on pharmaceuticals, and Walmart slipped 1% as it announced plans to cut costs in response to tariffs.
Market Movers
On Tuesday, the top gainers were CorMedix Inc (+21.25%), followed by Nyxoah SA (+19.44%). On the contrary CVRx, Inc (-30.68%) and Classover Holdings, Inc (-19.64%) declined the most the same day.
Commodities Update
Crude oil prices continued their downward spiral on Wednesday, with WTI futures dropping over 3% to below $58 per barrel and Brent falling more than 3% to under $61. Both benchmarks have now logged five consecutive sessions of losses, driven by escalating concerns over weakening global demand amid the intensifying U.S.-China trade war. The imposition of steep 104% U.S. tariffs on Chinese imports — a direct hit to the world’s top oil importer — has sparked fears of a prolonged dispute, with China vowing to "fight to the end." Adding to bearish sentiment, OPEC+ recently announced plans to significantly increase output in May, further pressuring the market already facing oversupply. Since April 2, WTI has shed around 20% and Brent over 19% of their respective values. Meanwhile, U.S. crude inventories fell by 1.1 million barrels last week, slightly offsetting concerns about rising supply.
In contrast, gold surged over 2% to around $3,040 per ounce, buoyed by strong safe-haven demand as investors sought refuge from mounting recession fears triggered by the trade standoff. Alongside the aggressive tariffs targeting China, President Trump signaled plans to introduce new duties on pharmaceutical imports, heightening economic uncertainty. China has rebuked the tariffs as "blackmail," deepening fears of prolonged global instability. Supporting gold’s rally, the World Gold Council reported a significant inflow of 226.5 metric tons into gold-backed ETFs in Q1 — the largest in three years. Investors now await the U.S. Federal Reserve's March meeting minutes for insights into the central bank's outlook on potential rate cuts.
Macro Update
U.S. Treasury yields rose on Wednesday as investors reacted to President Trump’s sweeping tariffs and their potential impact on growth and inflation. The 10-year yield briefly hit 4.5% before settling around 4.35%, while the 30-year yield climbed above 4.8%, its highest in about two months. The jump in yields reflects growing recession and inflation concerns, which may constrain the Federal Reserve’s ability to cut rates. Additional pressure came from reports of foreign selling and a broader move toward liquidity. A weak $58 billion auction of 3-year notes on Tuesday further highlighted market unease following the tariff escalation.
Futures Update
U.S. stock futures tumbled as China announced additional reciprocal tariffs on U.S. goods, escalating the trade war and amplifying fears of a global recession. The Dow, S&P 500, and Nasdaq 100 futures all posted sharp declines, continuing the market volatility seen in recent sessions. The S&P 500 recently closed below the 5,000 mark for the first time in nearly a year and is now nearing bear market territory, down nearly 19% from its record high. Over the past four days, the Dow has shed more than 4,500 points, while the S&P 500 and Nasdaq have dropped 12% and 13%, respectively.
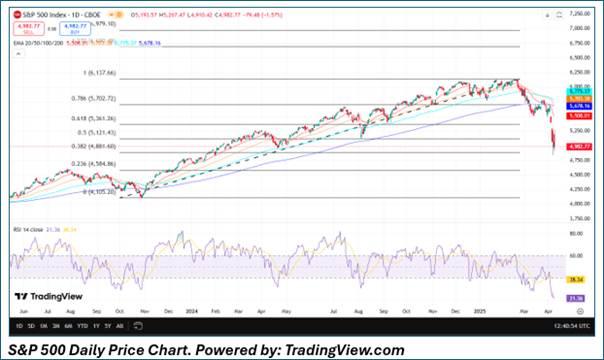
The S&P 500 recently demonstrated significant bearish tendencies, marked by critical technical developments and momentum indicators that suggest further downside risks. On Tuesday, the index settled 1.57% lower, breaking below the psychological support level of 5,000. It has retraced approximately 61.8% from its recent highs, hovering near the crucial support level of 4,881, a key Fibonacci retracement zone where reversals or accelerations in price movement are likely. The index is trading below its 200-day, 50-day, and 21-day Exponential Moving Averages (EMAs), confirming a bearish trend. Additionally, the 14-day Relative Strength Index (RSI) has settled at 21.36, firmly placing the index in an oversold zone. While this oversold condition might suggest a potential short-term rebound, the prevailing bearish sentiment and sustained selling pressure indicate that further declines are possible if selling pressure persists. Overall, the S&P 500's technical setup remains bearish, with traders closely watching key support levels and momentum indicators for signs of stabilization or further weakness


 Please wait processing your request...