
Key Highlights
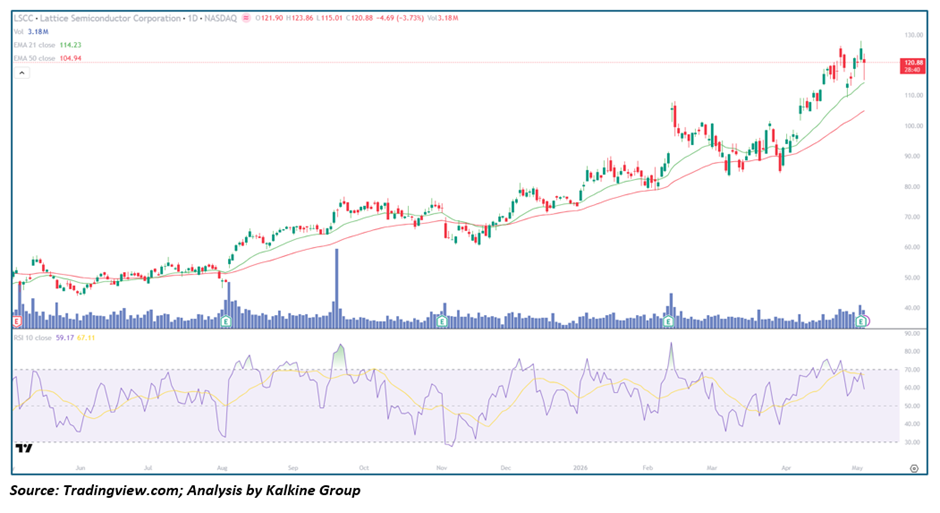
- Lattice Semiconductor Corporation (NASDAQ: LSCC) is trading near the $120 zone after a sustained multi-month uptrend with consistent higher highs and higher lows
- Price is trading above the 21-day EMA (~$114.23) and 50-day EMA (~$104.94), confirming bullish moving average alignment
- RSI-10 at 59.17 reflects healthy mid-range momentum with room for further upside before overbought conditions
- Volume has expanded during key rally legs, with notable spikes confirming institutional participation
- Structure shows a well-defined uptrend from mid-2025 lows near $45, with price more than doubling over the period
Trend Structure: Uptrend Continuation
LSCC is maintaining a strong bullish structure within a clearly defined and sustained upward trend.
Key observations include:
- Consistent formation of higher highs and higher lows from the June 2025 base near $45
- Controlled pullbacks to moving average support followed by renewed upward legs
- Price holding above both the EMA-21 and EMA-50 throughout the trend
This suggests:
- Buyers remain firmly in control across both short and medium timeframes
- The trend is maturing but showing no signs of structural deterioration
- Each pullback is being absorbed at progressively higher support levels
The structure reflects an active continuation phase within one of the stronger trending setups in the semiconductor sector.
Price Action: Pullback and Recovery
Recent price behavior highlights resilience and sustained demand following each corrective phase:
- Multi-month rally from ~$45 in June 2025 to a high near $123–$125 by early May 2026 — a near 175% appreciation
- Controlled pullbacks along the way to the EMA-21, each of which held and led to a renewed leg higher
- Most recent session shows a -3.73% decline to $120.88, representing a healthy short-term pullback within the trend
This implies:
- The correction is normal and consistent with prior pullback behavior in this trend
- Strong demand exists at and near the EMA-21 ($114) on any dips
- Buyers have consistently stepped in at lower levels throughout the trend's duration
Such action typically signals continuation of the broader uptrend, with the current pullback likely to be resolved to the upside as long as the EMA-21 holds.
Moving Averages: Bullish Alignment
The moving average configuration for LSCC is unambiguously constructive:
- Price at $120.88 is trading above both the 21-day EMA ($114.23) and 50-day EMA ($104.94)
- The EMA-21 is positioned well above the EMA-50 — a confirmed and sustained golden cross alignment
- Both moving averages are steeply trending upward, reflecting months of directional momentum
Interpretation:
- Short-term trend is strongly bullish
- Medium-term trend is fully supportive with the EMA-50 acting as a rising floor
- Any pullback toward the $114 EMA-21 zone is likely to attract fresh buyers
Momentum Indicators: Healthy Mid-Range
RSI-10 is reading 59.17, with its smoothing average at 67.11.
Key signals:
- RSI is in healthy bullish territory — above 50 but not in overbought zone
- The smoothing average above the RSI line suggests momentum peaked recently and is now normalizing in a healthy reset
- No bearish divergence visible; price remains near highs while RSI consolidates constructively
Interpretation:
- Meaningful upside potential remains before momentum becomes stretched
- The RSI reset from prior highs is a positive development, creating room for the next rally leg
- No immediate exhaustion signal on the broader trend
Volume Analysis: Confirmed Participation
Volume analysis supports the legitimacy of LSCC's uptrend:
- Notable volume spikes in August 2025 and again in April–May 2026 coincide with the strongest rally legs
- Rally days consistently show higher volume relative to pullback days — a classic sign of healthy trend continuation
- No signs of distribution or abnormal selling at elevated price levels
This indicates:
- Institutional accumulation has been present throughout the trend
- The rally is demand-driven rather than speculative or low-conviction
- The trend has the participation profile of a sustainable move
Market Structure: Sustained Uptrend
The broader structure for LSCC reflects a textbook trending environment:
- A strong and clean primary uptrend spanning nearly twelve months
- Controlled corrections that consistently held above rising moving averages
- Resumption of upward movement after each corrective phase with volume confirmation
This combination suggests:
- Trend continuation remains the primary scenario
- Pullbacks into the $114–$105 zone should be viewed as opportunities within the broader bullish context
- Positive market sentiment toward the stock remains intact
Key Technical Levels and Scenarios
Support Levels
- $114.23 as immediate support (EMA-21)
- $108–$110 as short-term support zone
- $104.94 as major support (EMA-50)
Resistance Levels
- $123–$125 as immediate resistance (recent highs)
- $130 as next upside target
- $140+ as extended bullish target
Scenarios
- Bullish Continuation (Primary Case)
- Price holds above $114 EMA-21 on current pullback
- RSI stabilizes above 55 and resumes upward trajectory
- Volume re-expands on next rally leg
- Rally toward $130–$140 zone
- Consolidation (Secondary Case)
- Price ranges between $110 and $125 while EMAs catch up
- RSI oscillates between 50 and 65
- Trend structure remains intact ahead of next breakout
- Pullback Scenario (Low Probability)
- Price breaks below EMA-21 ($114) on elevated volume
- Retest of EMA-50 near $104–$105
- Buyers likely to re-enter aggressively at EMA-50 given trend strength
Conclusion: Bullish Structure with Continued Upside Potential
Lattice Semiconductor Corporation is exhibiting one of the cleaner and more sustained uptrends in the semiconductor space, supported by bullish EMA alignment, healthy mid-range RSI momentum, and volume-confirmed rally legs. The current -3.73% pullback from the $125 high is entirely consistent with prior corrective behavior within this trend and does not represent any structural damage. As long as the EMA-21 ($114) holds as support, the broader uptrend remains firmly intact with scope for continuation toward $130 and beyond. Investors should monitor volume behavior on any renewed move above $125 as the key confirming signal for the next leg higher.


 Please wait processing your request...