
Key Highlights
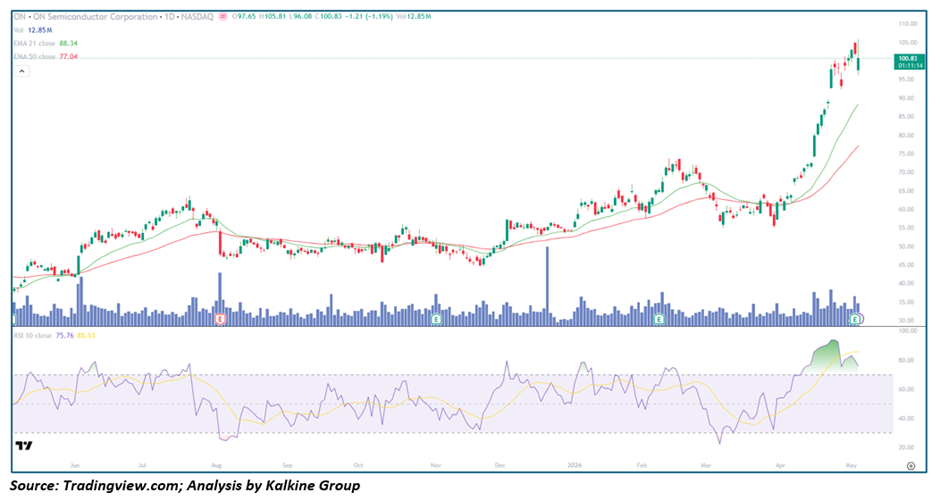
• ON Semiconductor Corporation (NASDAQ: ON) is trading near the $100 zone after a strong recovery from a recent pullback
• Price is trading above the 21-day (~$88.34) and 50-day (~$77.04) moving averages
• RSI near ~75 indicates strong momentum, moderating from prior overbought extremes
• Volume remains elevated with expansion during recent rally phases
• Structure shows a pullback followed by continuation within a broader multi-month uptrend
Trend Structure: Uptrend Continuation
ON Semiconductor is maintaining a strong bullish structure within a broader upward trend.
Key observations include:
• Formation of consistent higher highs and higher lows
• Strong multi-month rally with controlled corrections
• Price holding firmly above key moving averages
This suggests:
• Buyers remain in control
• Trend structure remains intact
• Pullbacks are being absorbed efficiently
The structure reflects a continuation phase within an established uptrend supported by strong participation.
Price Action: Pullback and Recovery
Recent price behavior highlights resilience after correction:
• Sharp rally from mid-cycle lows toward the $105 zone
• Higher low formation following brief pullback
• Renewed upward movement toward key psychological levels
This implies:
• Healthy correction within the trend
• Strong demand at lower levels
• Buyers stepping in aggressively on dips
Such action typically signals:
• Continuation of the prevailing uptrend
• Potential retest and breakout above prior highs
Moving Averages: Bullish Alignment
The moving average setup confirms strong trend structure:
• Price trading well above both 21-day and 50-day EMAs
• 21-day EMA positioned above 50-day EMA
• Both averages trending upward
Interpretation:
• Short-term trend strongly bullish
• Medium-term trend supportive
• Pullbacks likely to attract fresh buying interest
Momentum Indicators: Recovery Phase
RSI is positioned in the 70–75 zone.
Key signals:
• Momentum remains strong but cooling from extremes
• No bearish divergence visible
• RSI stabilizing after overbought conditions
Interpretation:
• Upside potential remains intact
• Short-term consolidation possible
• Momentum likely to rebuild for next leg
Volume Analysis: Strong Participation
Volume trends indicate:
• Expansion during rally phases
• Higher participation on breakout moves
• Lower volume on pullbacks
This suggests:
• Institutional buying interest
• Healthy continuation dynamics
• No clear signs of distribution
Market Structure: Pullback Within Uptrend
The broader structure reflects:
• Strong primary uptrend
• Controlled correction forming higher lows
• Resumption of upward movement
This combination suggests:
• Trend continuation likely
• Pullbacks acting as buying opportunities
• Positive sentiment across the structure
Key Technical Levels and Scenarios
Support Levels
• 92–95 as immediate support
• 88 as EMA-21 support
• 77 as major support (EMA-50)
Resistance Levels
• 105 as immediate resistance
• 110–115 as next upside zone
• 120+ as extended target
Scenarios
- Bullish Continuation (Primary Case)
• Price sustains above 95–100 zone
• Momentum strengthens again
• Volume supports breakout
• Rally toward 110–120 - Consolidation (Secondary Case)
• Price ranges between 88–105
• RSI stabilizes near 60–65
• EMAs catch up to price
• Trend remains intact - Pullback Scenario (Low Probability)
• Price drops below 88
• Retest of 77–80 zone
• Buyers likely re-enter at support
Conclusion: Bullish Structure with Continued Upside Potential
ON Semiconductor Corporation is exhibiting a strong uptrend supported by bullish moving average alignment, elevated but stabilizing momentum, and strong volume participation. The recent pullback appears to be a healthy consolidation rather than a reversal, with the stock maintaining its position well above key support levels. As long as the $88–$95 zone holds, the broader trend remains firmly bullish with potential continuation toward the $110–$120 range.


 Please wait processing your request...