
Key Highlights
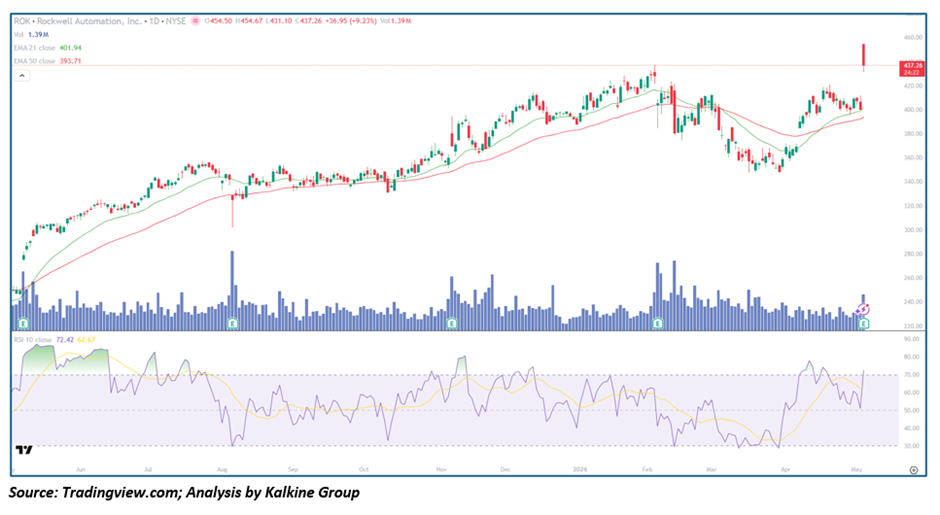
- Rockwell Automation, Inc. (NYSE: ROK) has surged sharply toward the $437 zone after a strong rebound from the February–March 2026 lows near $355
- Price is trading above the 21-day EMA (~$401.94) and 50-day EMA (~$393.71), confirming bullish moving average alignment
- RSI-10 at 72.42 reflects strong momentum approaching overbought conditions, with smoothing average at 62.67 confirming the upward shift
- Volume expanded significantly on the latest rally candle, with the most recent session printing +9.23% on elevated participation
- Structure shows a sharp recovery breakout from a prolonged correction phase, with price reclaiming key moving averages decisively
Trend Structure: Reversal with Momentum Expansion
ROK is showing a transition from a multi-month corrective phase into a potential bullish reversal and trend resumption.
Key observations include:
- Prior sustained correction from the November 2025 highs near $430 down to February 2026 lows near $355 — approximately a 17% drawdown
- Formation of a base in the $355–$375 zone through February–March 2026
- Strong upward breakout with aggressive follow-through, including a +9.23% single-session surge
This suggests:
- Sellers have exhausted their control after the multi-month correction
- Buyers are aggressively stepping in at discounted levels
- A new upward trend phase is emerging, potentially resuming the broader primary uptrend
The structure reflects a trend reversal with clear momentum acceleration off the lows.
Price Action: Sharp Recovery Breakout
Recent price behavior highlights strong bullish activity following the corrective base:
- Controlled decline from $430 highs in November 2025 to a low near $355 in February–March 2026
- Higher low formation and base consolidation in the $355–$380 zone
- Explosive breakout candle in the most recent session, driving price to $437.26 on the highest volume in weeks
This implies:
- Aggressive buying interest has emerged, likely catalysed by a positive fundamental development or broader sector rotation
- Momentum-driven participation is accelerating the move
- Strong conviction in the recovery is evident from the single-day +$36.95 price move
Such action typically signals continuation of the recovery trend and a potential full retest of prior highs near $430–$435, which have now been breached to the upside.
Moving Averages: Bullish Reclaim
The moving average configuration for ROK confirms the improving technical structure:
- Price at $437.26 is trading well above both the 21-day EMA ($401.94) and the 50-day EMA ($393.71)
- The EMA-21 is positioned above the EMA-50, maintaining a bullish short-over-medium alignment
- Both moving averages are now turning upward after the correction caused them to flatten and converge
Interpretation:
- Short-term trend has shifted decisively bullish
- Medium-term trend is turning supportive as the EMAs slope upward
- Any pullback toward the $400–$402 EMA-21 zone is likely to attract fresh buyers given the strength of the breakout
Momentum Indicators: Strong but Approaching Overbought
RSI-10 is reading 72.42, with its smoothing average at 62.67.
Key signals:
- RSI has broken above the 70 threshold, reflecting strong and accelerating momentum
- The RSI line is well above its smoothing average — confirming the upward thrust is fresh and not yet exhausted
- No bearish divergence present; price and RSI are both making new highs in tandem
Interpretation:
- Momentum remains strong and trend-positive
- The elevated RSI introduces a risk of short-term consolidation or minor pullback after the sharp single-day surge
- The broader momentum trend favors continued upside once any near-term digestion completes
Volume Analysis: Strong Participation
Volume trends validate the strength of the current breakout:
- The most recent session registered 1.39 million shares — one of the highest single-day readings on the chart
- Prior rally legs throughout the trend have been accompanied by above-average volume spikes
- Pullback and corrective phases showed lower relative volume, indicating a lack of aggressive distribution
This indicates:
- Institutional buying is very likely behind the latest surge
- The breakout move has strong demand backing and is not a low-conviction spike
- The move carries credibility and raises the probability of follow-through in subsequent sessions
Market Structure: Recovery Breakout Within Broader Uptrend
The broader structure for ROK reflects a healthy correction followed by a powerful resumption:
- A strong primary uptrend from the June 2025 lows near $285 to November 2025 highs near $430
- A controlled correction of approximately 17% that held well above the longer-term uptrend structure
- A sharp breakout that has now cleared the prior highs, marking a technical all-time high or multi-month high on the chart
This combination suggests:
- The primary uptrend is resuming after a healthy corrective pause
- Pullbacks should be viewed as buying opportunities within the broader bullish context
- Positive market sentiment toward industrials and automation names is driving renewed interest
Key Technical Levels and Scenarios
Support Levels
- $420–$425 as immediate support (prior resistance now flipped)
- $401.94 as short-term support (EMA-21)
- $393.71 as major support (EMA-50)
Resistance Levels
- $454–$455 as immediate resistance (session high)
- $460–$470 as next upside zone
- $500 as extended bullish target
Scenarios
- Bullish Continuation (Primary Case)
- Price holds above $420–$425 after digesting the surge
- RSI pulls back slightly then resumes upward trajectory
- Volume remains elevated on follow-through sessions
- Rally toward $460–$480 over coming weeks
- Consolidation (Secondary Case)
- Price ranges between $415 and $455 while momentum normalizes
- RSI cools from overbought levels toward the 55–65 zone
- Trend structure remains intact ahead of the next directional move
- Pullback Scenario (Low Probability)
- Profit-taking emerges after the sharp single-day surge
- Price retreats toward the EMA-21 near $401–$402
- Buyers likely to re-enter aggressively at the EMA cluster given the strength of the breakout
Conclusion: Strong Recovery with Continued Upside Potential
Rockwell Automation, Inc. is exhibiting a powerful recovery breakout supported by momentum expansion, volume confirmation, and a decisive reclaim of both key moving averages. The +9.23% single-session surge reflects strong conviction from buyers and marks a clear technical shift from the corrective phase that dominated February–March 2026. While the elevated RSI-10 at 72.42 suggests the possibility of brief near-term consolidation, the broader structure is firmly bullish. As long as the $400–$402 EMA-21 zone holds on any pullback, the primary trend is upward with scope for a continued advance toward $460 and beyond.


 Please wait processing your request...