
A powerful year-long uptrend meets its deepest correction — RSI oversold, MACD turning, and EMA-50 support defining the line between recovery and breakdown
Key Highlights
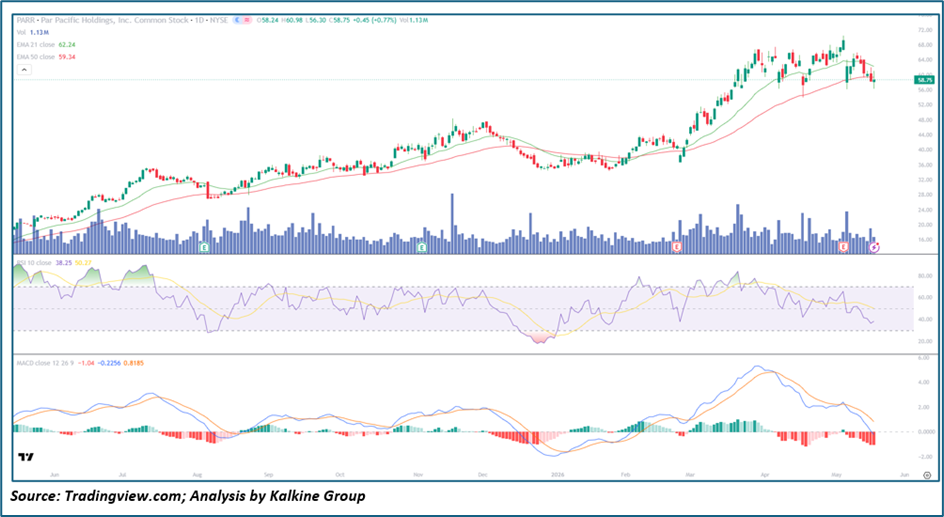
- Par Pacific Holdings, Inc. (NYSE: PARR) is trading at $58.75, up +$0.45 (+0.77%), attempting stabilisation after a sharp pullback from the $72 peak
- Stock rallied an impressive 177% from its June 2025 base of ~$26 to the February 2026 high of ~$72 — one of the strongest moves among NYSE-listed independent refiners
- EMA-21 ($62.24) and EMA-50 ($59.34) are both above current price — a bearish near-term configuration that must be reclaimed for the bull thesis to reassert itself
- Price is below both EMAs for the first time in months — a structural warning signal demanding close monitoring
- RSI-10 at 38.25 — in oversold territory with signal at 50.27, the most depressed reading since the February 2026 washout low — a potential mean-reversion setup forming
- MACD at -1.04 with signal at -0.2256 and histogram at 0.8185 — MACD remains in bearish territory but the histogram is turning positive, a nascent bullish divergence worth watching
- Volume at 1.13M — consistent with the elevated activity that has characterised the recent correction phase
Trend Structure: A Year-Long Bull Run Meets Its Most Serious Technical Test
Par Pacific's chart is a study in how even the strongest uptrends must eventually be tested — and how the quality of that test determines whether what follows is a continuation or a Reversal.
From the June 2025 base near $26, PARR embarked on one of the most impressive sustained rallies in the independent refining space — a methodical, multi-phase advance that constructed higher highs and higher lows with the discipline of institutional accumulation. The early phase from June to August 2025 took the stock from $26 to approximately $36, with the EMA-21 acting as consistent dynamic support throughout.
A sharp but brief August 2025 flush — visible as the single large red candle accompanied by an elevated volume spike — tested sentiment before the stock recovered decisively, resumed the uptrend, and accelerated through $40 toward $50 by October 2025. This recovery from the August shakeout, combined with the EMA-21 reclaim on strong volume, was the definitive signal that institutional buyers viewed any weakness as an accumulation opportunity.
The November–December 2025 consolidation between $40–$50 was a textbook mid-trend pause — allowing the EMAs to catch up, RSI to reset from overbought levels, and the MACD to digest its prior extended positive reading. The patience of this consolidation, followed by the January 2026 breakout above $50, reflected the hallmarks of a healthy trend with genuine fundamental underpinning.
The second and more powerful impulse wave from January through February 2026 launched PARR from $40 to the $72 peak — a 80% move in just six weeks that represented the acceleration phase of the uptrend, where momentum traders joined the institutional base already established. The RSI reached overbought territory and the MACD printed its highest reading of the entire trend during this phase.
The correction that followed from the $72 peak has been both sharper and deeper than any prior pullback in the uptrend — the stock has retraced approximately 20% from peak to the current $58.75 level, broken below the EMA-21, and is now testing the EMA-50 at $59.34. This is the most significant technical stress the uptrend has faced, and the next few sessions will determine its outcome.
The Catalysts: What Built the Uptrend and What Is Testing It Now
Independent Refining Margin Cycle Par Pacific operates refineries in Hawaii, Wyoming, and Montana — a geographically advantageous footprint that benefits from regional Supply-Demand dynamics and reduced competition compared to Gulf Coast refiners. The sustained uptrend from mid-2025 reflected a favourable refining margin environment as crack spreads widened and Operating Leverage amplified Earnings growth.
Hawaii Market Dominance PARR's Hawaii refinery operates with a near-Monopoly position in its local market — supplying approximately 70% of Hawaii's refined product demand. This structural Competitive Advantage insulates the company from the Commodity-price Volatility that affects more commoditised refining operations, and supports a premium valuation multiple relative to pure commodity refiners.
Logistics and Retail Integration Through its integrated logistics and retail network — including Hele and nomnom fuel retail brands — PARR captures margin at multiple points in the supply chain, providing earnings stability that a pure refiner cannot match.
Earnings Events — Mixed Signals The four visible earnings events (E markers) on the chart show a mixed but ultimately supportive pattern — each one was initially met with volatility, but the stock consistently found buyers in the aftermath. The most recent earnings marker at the right edge of the chart has coincided with the current pullback — suggesting the market may be digesting results that, while not negative, fell short of the elevated expectations embedded in the $72 peak valuation.
Current Correction Driver The pullback from $72 to $58.75 is most consistent with a combination of profit-taking after the rapid January–February acceleration, normalisation of refining margins from peak levels, and broader energy sector rotation. Crucially, there is no visible Capitulation volume spike at the lows — suggesting this is an orderly correction rather than a fundamental breakdown.
Moving Averages: The EMA-50 Battle Line Is Drawn
- EMA-21 ($62.24) — declining from peak levels, now acting as overhead resistance approximately 6% above current price; reclaiming this level is the first requirement for a bullish trend restoration
- EMA-50 ($59.34) — rising but beginning to flatten, providing the critical dynamic support level at $59.34 — just $0.59 above the current close of $58.75
The relationship between price and the EMA-50 is the single most important technical variable on this chart right now. Throughout the entire year-long uptrend, the EMA-50 was never violated on a sustained closing basis — it was tested in August 2025, in November 2025, and in January 2026, and each time it held and launched the next leg higher. A closing break below $59.34 — especially on elevated volume — would be a meaningful structural warning that the trend character has changed.
Conversely, a bounce from the EMA-50 that recaptures the EMA-21 at $62.24 within the next 1–2 weeks would confirm that the correction is complete and the broader uptrend remains intact — the highest-probability bull case given the historical reliability of this support level.
Momentum &Amp; Volume: Oversold RSI Meets Turning MACD — A Classic Mean-Reversion Setup
RSI Analysis The RSI-10 at 38.25 — with signal at 50.27 — is at its most oversold level since the February 2026 washout, when a similarly depressed RSI reading preceded a powerful recovery rally. The RSI signal line sitting well above the RSI itself at 50.27 reflects the speed of the recent momentum deterioration, but also creates the setup for a mean-reversion bounce when RSI begins to recover toward its signal line. Historically on this chart, every RSI reading below 40 has been followed by a recovery toward 60–70 within 2–4 weeks — making the current reading a statistically relevant mean-reversion trigger.
MACD Analysis — The Most Constructive Signal on the Chart The MACD configuration is arguably the most important indicator reading in today's setup. The MACD line at -1.04 remains in bearish territory below the signal line at -0.2256 — confirming the correction is not yet over from a trend-following perspective. However, the histogram at +0.8185 has turned positive — meaning the gap between the MACD and signal lines is narrowing and the bearish momentum is decelerating. This histogram inflection is the classic early warning of an impending MACD bullish crossover, which — if it materialises above the zero line — would be a powerful momentum reversal signal coinciding with a potential EMA-50 bounce.
Volume Analysis Volume at 1.13M is elevated relative to the quiet periods of the mid-trend consolidation but not at the extreme spike levels that would indicate capitulation or panic selling. The absence of a high-volume flush at the lows suggests that sellers are not desperate and buyers are present at current levels — a constructive backdrop for a stabilisation and recovery attempt.
Key Technical Levels and Scenarios
Resistance Levels
- $59.34 — EMA-50 — immediate level being tested; must hold on a closing basis
- $62.24 — EMA-21 — first major resistance and trend restoration trigger
- $64.00–$65.00 — Recent consolidation support now acting as overhead supply
- $68.00–$70.00 — Prior peak zone and major resistance on any recovery
- $72.00 — All-time high — ultimate bull case target on full trend restoration
Support Levels
- $58.75 — Current price and immediate support
- $56.00–$57.00 — Prior breakout zone from the January 2026 acceleration — key structural support
- $52.00–$53.00 — November–December 2025 consolidation base — major support on deeper correction
- $44.00–$46.00 — Last line of trend defence — a break here would signal a fundamental trend change
Scenarios
- EMA-50 Hold and Recovery (Primary Case)The EMA-50 at $59.34 provides the expected support, price stabilises in the $58–$60 zone over the next 2–3 sessions, and the MACD histogram continues building toward a bullish crossover. RSI recovers above 50, the stock recaptures the EMA-21 at $62.24, and the uptrend resumes toward the $68–$70 prior peak zone. This scenario is supported by the historical reliability of EMA-50 support across the prior year and the constructive MACD histogram reading.
- Sideways Consolidation Base (Secondary Case)PARR oscillates between $56–$63 for 2–4 weeks, building a new consolidation base similar to the November–December 2025 pattern. The EMAs converge, RSI normalises to the 45–55 range, and the MACD completes its cross above the signal line — setting up a higher-quality breakout entry above $63 with more favourable risk/reward than chasing the current bounce. Patient investors use this period to accumulate in the $57–$60 zone.
- EMA-50 Breach and Deeper Correction (Risk Case)A closing break below the EMA-50 at $59.34 on elevated volume triggers technical selling toward the $56–$57 structural support zone. If this level also fails, the $52–$53 November 2025 base becomes the next major target. This scenario would require a fundamental deterioration — refining margin collapse, company-specific negative news, or broader energy sector de-risking — and currently represents the lower-probability outcome given the absence of capitulation volume at current levels.
The Bear Case: The First Real Crack in a Year-Long Structure
Despite the broadly constructive longer-term picture, the current setup carries real near-term risks:
- Price below both EMAs for the first time in many months is a meaningful structural shift — the trend is no longer unambiguously bullish on a short-term basis, and the burden of proof has shifted to bulls to demonstrate demand at current levels
- MACD remains in bearish territory — the histogram inflection is encouraging but the crossover has not yet occurred, and premature optimism on an uncompleted signal is a common technical trading error
- Independent refining is cyclically sensitive — Crack Spread compression, Crude Oil price volatility, and demand destruction fears can rapidly alter the earnings outlook that underpins the valuation, and the market may be pricing in normalisation of the exceptional margin environment that drove the 177% rally
- The 20% correction from $72 is the deepest in the trend — while this alone does not signal a trend change, it does indicate that selling pressure has intensified and that the prior pattern of shallow $5–$8 pullbacks has been replaced by something more structurally significant
- Hawaii regulatory and operational risks — as a regionally concentrated refiner, PARR remains exposed to Hawaii-specific regulatory, environmental, and demand dynamics that can create earnings surprises in either direction
Conclusion: A High-Stakes Test of a Year-Long Uptrend — The EMA-50 Is the Line in the Sand
Par Pacific Holdings has built one of the most impressive fundamental and technical cases in the independent refining sector over the past year — a 177% rally grounded in genuine operational improvement, structural competitive advantages, and a favourable macro backdrop for refining margins.
The current pullback from $72 to $58.75 is the most serious technical challenge the uptrend has faced. But the evidence for a trend-ending breakdown is not yet present: volume is orderly rather than panicked, RSI is at historically mean-reverting oversold levels, the MACD histogram has turned constructive, and the EMA-50 — which has supported the stock at every major test for twelve months — is directly beneath current price.
The trade is straightforward: the EMA-50 at $59.34 is the line in the sand. A daily close below this level on elevated volume changes the picture and demands risk reduction. A bounce that holds this level and recaptures the EMA-21 at $62.24 confirms the correction is complete and opens the path back toward $68–$72.
For position traders, the $58–$60 zone represents a defined-risk long entry with a stop below $56 and an initial target of $62–$65. For investors with a medium-term horizon, the fundamental case for PARR — Hawaii market dominance, integrated logistics margins, and a management team that has demonstrated consistent operational delivery — remains intact, making any EMA-50 support confirmation a compelling accumulation opportunity.
The next 3–5 sessions will resolve the ambiguity. Watch the EMA-50, watch the MACD crossover, and watch whether volume on any recovery exceeds volume on the current selling — the answer to all three will determine whether $72 is a ceiling or merely a waypoint on a longer journey higher.


 Please wait processing your request...