
An expanding triangle formation, a completed ABCD harmonic sequence, and a narrowing price range — WTI Crude is coiling toward a high-conviction directional break
Key Highlights
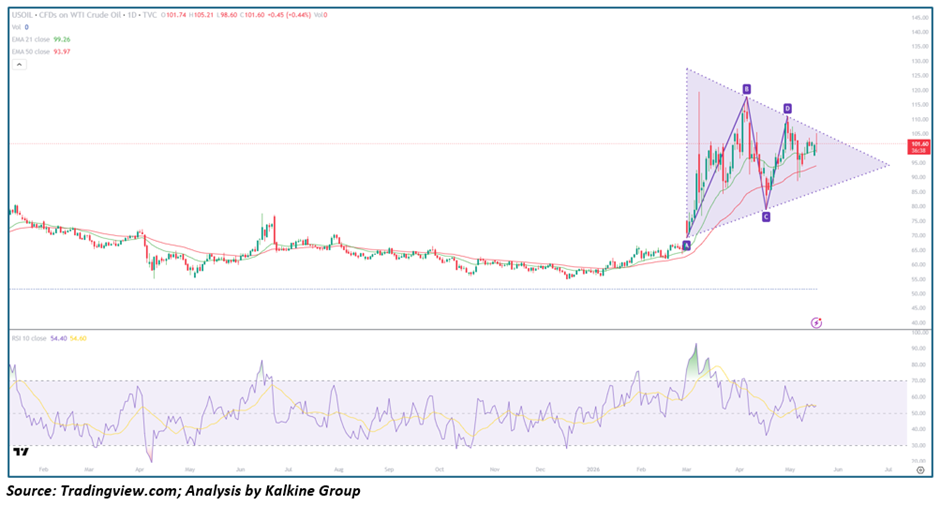
- WTI Crude Oil (TVC: USOIL) is trading at $101.55, up +$0.40 (+0.40%), consolidating within a well-defined broadening wedge pattern
- Price has traced a clear ABCD harmonic structure — Point A (~$70), Point B (~$120), Point C (~$78), Point D (~$112) — a classic zigzag sequence that defines the boundaries of the expanding triangle
- EMA-21 ($99.25) and EMA-50 ($93.97) are both rising and well-separated — confirming the broader trend structure remains bullish despite the pattern Volatility
- Price is above the EMA-21 at $101.55 — a constructive near-term signal within an otherwise complex pattern environment
- RSI-10 at 54.31 — neutral with signal at 54.60, reflecting the indecision characteristic of a market caught inside a broadening formation
- The upper boundary of the broadening wedge is descending toward approximately $105–$107, while the lower boundary is rising toward $92–$94 — the pattern is compressing toward resolution
- The horizontal dotted resistance line near $103–$104 has capped multiple rally attempts and represents the critical near-term ceiling
Pattern Analysis: The Broadening Wedge — A Rare and Powerful Formation
The broadening wedge — also known as a megaphone or expanding triangle — is one of the most psychologically complex patterns in Technical Analysis, and WTI's chart has constructed a near-textbook example of the formation over the past three months.
Unlike a standard wedge or triangle where price contracts toward a single apex, the broadening wedge is defined by diverging boundaries — each successive high is higher than the last, and each successive low is lower than the last, creating an expanding price envelope that reflects genuine uncertainty and institutional disagreement about Fair Value. This pattern most commonly appears at major trend inflection points and in high-volatility macro markets — both conditions that describe the current crude oil environment precisely.
Point A (~$70, early March): The pattern originates at the spike low — a sharp flush to $70 that established the lower boundary anchor. The violence of this move on what appears to have been a macro shock created the extreme reading that set up the entire subsequent structure.
Point B (~$120, mid-March): The recovery from Point A was equally violent — a near-parabolic surge to $120 that overshot fair value to the upside, establishing the upper boundary anchor. The RSI pushed into deeply overbought territory during this phase, confirming the excess.
Point C (~$78, late March): The correction from Point B found support above the Point A low — a higher low that is the critical structural requirement for a broadening wedge to be classified as bullish. The C point near $78 formed on declining RSI and elevated selling Volume before the next recovery began.
Point D (~$112, early April): The recovery from Point C surged toward but failed to exceed Point B — a lower high within the upper boundary of the expanding structure. This D point completion technically validates the ABCD harmonic sequence and signals that the pattern is entering its resolution phase.
Current Position: Price at $101.55 is now oscillating within the narrowing interior of the pattern — caught between the descending upper boundary (~$105–$107) and the rising EMA-50 support (~$93.97). The boundaries are converging, and a directional break is approaching.
The Macro Catalysts: What Is Driving WTI's Volatility Architecture
Geopolitical Supply Shock Origins The extreme volatility embedded in the broadening wedge — a $50 range from $70 to $120 in under two months — reflects genuine macro uncertainty rather than technical noise. Supply disruption fears, OPEC+ production decisions, and sanctions-related flow disruptions have created the kind of binary outcome risk that produces exactly this pattern.
Demand Uncertainty Simultaneously, global demand growth expectations have been oscillating between Recession fears (pushing oil lower) and resilient growth narratives (pushing oil higher) — a genuine fundamental disagreement that maps directly onto the alternating upper and lower boundary touches of the broadening wedge.
Dollar Dynamics WTI is priced in USD, and periods of dollar strength versus dollar weakness have amplified the price swings visible in the pattern — adding a currency overlay to the already-volatile supply/demand picture.
EMA Recovery Narrative The fact that both EMAs are rising — and that price has consistently found support at or near the EMA levels during each correction within the pattern — suggests the underlying trend is bullish and that the broadening wedge is forming within a broader uptrend rather than as a topping pattern.
Moving Averages: Bullish Anchors Within a Volatile Structure
- EMA-21 ($99.25) — rising steadily, has acted as dynamic support during the April–May consolidation phase; current price above this level is constructive
- EMA-50 ($93.97) — rising at an accelerating pace, aligning closely with the lower boundary of the broadening wedge in the $92–$95 zone — creating a powerful confluence support level
The alignment of the rising EMA-50 with the ascending lower boundary of the broadening wedge is one of the most important observations on this chart. It means that a test of the pattern's lower boundary simultaneously tests the EMA-50 — a double support zone that, if held, would represent one of the highest-conviction long entries available in the current WTI structure.
The EMA-21 acting as near-term support above $99 while price consolidates below the horizontal resistance at $103–$104 creates a classic coiling structure — the market is compressing energy for a directional break.
Momentum: RSI Neutrality Reflects Pattern Indecision
The RSI-10 at 54.31 — with signal at 54.60 and the two lines essentially converged — is the most neutral reading possible, perfectly reflecting the pattern context. WTI is not overbought, not oversold, and not trending in either direction from a momentum perspective — it is genuinely uncertain, oscillating between the broadening wedge boundaries with no directional conviction.
This RSI neutrality is actually a setup signal rather than a concern. When price is coiling within a pattern and RSI is neutral, the eventual directional break tends to be accompanied by a sharp RSI move — either toward 70+ on an upside breakout or toward 35–40 on a downside breakdown. Traders should watch for RSI confirming whichever directional move materialises rather than predicting it.
Key Technical Levels and Scenarios
Resistance Levels
- $103.00–$104.00 — Horizontal dotted resistance line; has capped multiple rally attempts — the immediate ceiling
- $105.00–$107.00 — Descending upper boundary of the broadening wedge
- $112.00 — Point D high — major resistance on any extended bullish breakout
- $120.00 — Point B all-time high of the pattern — ultimate bull case
Support Levels
- $99.25 — EMA-21 — immediate dynamic support
- $95.00–$96.00 — Recent consolidation floor within the pattern
- $93.97 — EMA-50 — major structural support coinciding with the lower wedge boundary
- $92.00–$93.00 — Ascending lower boundary of the broadening wedge — maximum confluence support zone
- $78.00 — Point C low — pattern invalidation level and ultimate stop reference
Scenarios
- Bullish Breakout Above $104 (Primary Bull Case) Price breaks above the horizontal resistance at $103–$104 with conviction — ideally on an elevated volume session or a positive macro catalyst such as a supply disruption or OPEC+ production cut. RSI pushes above 60 and toward 70, the EMA-21 accelerates upward, and WTI targets the Point D high of $112 and potentially challenges the Point B high of $120. This scenario is supported by the rising EMA structure and the fact that the broadening wedge is forming within what appears to be a broader uptrend.
- Lower Boundary Test and Bounce (Secondary Bull Case) Price pulls back from the current $103–$104 resistance ceiling toward the confluence support zone at $92–$95 where the EMA-50 meets the ascending lower boundary of the wedge. This lower boundary test — if accompanied by declining RSI toward the 35–40 zone and then a recovery — would represent the highest-quality long entry within the pattern, with a defined stop below the Point C low at $78 and a target back toward $110–$112.
- Pattern Breakdown (Bear Case) A sustained close below the ascending lower boundary and the EMA-50 at $93 — especially on elevated volume and with RSI declining below 40 — would signal a broadening wedge breakdown. This is typically a bearish signal when the pattern forms at a major high, though in this case the formation appears within a broader uptrend, moderating the bearish implications. A breakdown targets $78 (Point C) initially, with $70 (Point A) as the extended downside.
The Broadening Wedge: Bullish or Bearish Resolution?
The directional bias of a broadening wedge resolution is one of the most debated questions in technical analysis — and for good reason, as the pattern can resolve in either direction with equal frequency.
The bullish case is supported by: rising EMAs, price forming within an existing uptrend, the higher-low structure of Point C versus Point A, and the EMA-50 confluencing with the lower boundary.
The bearish case is supported by: the declining upper boundary creating a series of lower highs, the failure to break the horizontal resistance at $103–$104 on multiple attempts, and the inherent volatility of the pattern suggesting participants are genuinely uncertain.
The resolution signal will come from: a volume-confirmed close above $104 (bullish) or a volume-confirmed close below $93 (bearish) — and critically, the RSI confirmation in the direction of the break.
The Bear Case: Macro Risks Remain Substantial
Despite the constructive EMA structure, WTI's macro risk profile demands acknowledgment:
- Demand destruction risk from a global economic slowdown — particularly a Chinese demand shortfall — remains the most significant fundamental bearish catalyst and could rapidly push WTI toward or below the lower boundary
- OPEC+ production increases — any Reversal of the output discipline that has supported prices would fundamentally alter the supply picture and collapse the premium embedded in current prices
- Dollar strengthening — a risk-off macro environment that drives USD higher would create mechanical headwinds for USD-denominated oil prices
- The broadening wedge itself is a pattern of indecision — and the failure to break above $104 on multiple attempts over several weeks suggests that sellers are defending that level with conviction
Conclusion: Coiling Toward Resolution — The $104 Ceiling and $93 Floor Define the Trade
WTI Crude Oil is at a technically fascinating juncture — a completed ABCD harmonic within a broadening wedge, with rising EMAs providing structural support and a well-defined horizontal resistance ceiling compressing price toward an inevitable directional resolution.
The framework is clear: above $104 on a confirmed close, the bull case targets $112 and potentially $120. Below $93 on a confirmed close, the bear case targets $78. Everything between these levels is pattern noise — and the current $101.55 price is squarely in the middle of that noise zone.
For traders, the optimal approach is to wait for pattern resolution rather than anticipate it — fading the upper boundary at $105–$107 with tight stops for a lower boundary test, or buying a confirmed breakout above $104 with a target of $112. The EMA-50 confluence at $93–$94 remains the highest-conviction long entry if patience allows for the deeper test.
The broadening wedge is WTI's way of telling the market it hasn't yet decided. When it does, the move will be significant — and the ABCD roadmap provides the levels that will matter most when the decision is made.


 Please wait processing your request...