
Key Highlights
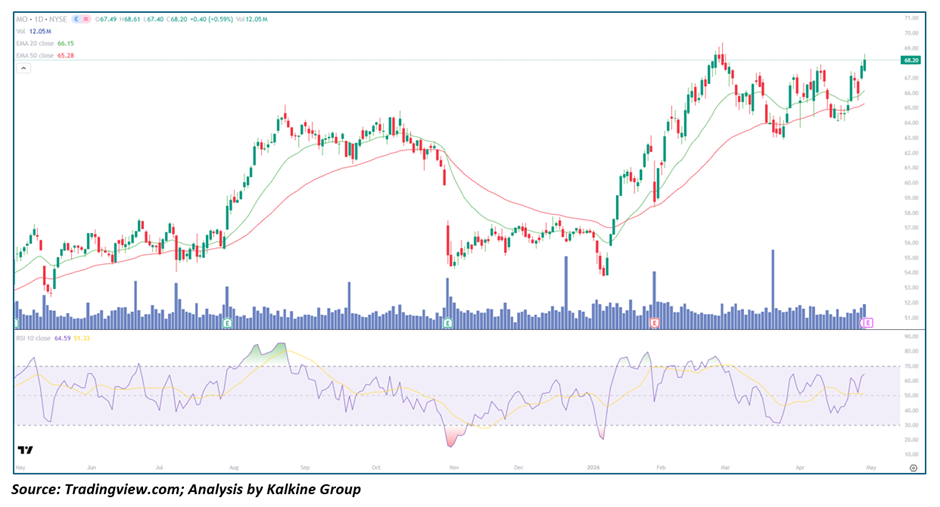
• Altria Group (NYSE: MO) is trading above its 20-day (~66.15) and 50-day (~65.28) moving averages, confirming a bullish trend
• Price is approaching the 68–69 resistance zone with a steady upward move
• RSI near mid-60s indicates healthy momentum without extreme overbought conditions
• Volume remains stable with occasional spikes during advances
• Structure reflects consistent higher highs and higher lows
Trend Structure: Stable and Controlled Uptrend
MO is exhibiting a well-structured bullish trend with steady progression.
Key observations include:
• Consistent formation of higher highs and higher lows
• Gradual price appreciation rather than sharp spikes
• Strong recovery from prior lows near the 55 zone
This suggests:
• Buyers are in steady control
• Trend strength is sustainable
• Low Volatility uptrend compared to high-Beta stocks
Price Action: Gradual Climb Toward Resistance
Recent price behavior highlights controlled bullish movement:
• Series of small to moderate bullish candles
• Healthy pullbacks followed by continuation
• Price nearing prior highs around 68–69
This implies:
• Accumulation-driven rally
• Limited selling pressure
• Potential breakout setup forming
Such action typically signals:
• Sustainable trend continuation
• Possibility of breakout after consolidation
Moving Averages: Strong Support Alignment
The Moving Average structure supports the trend:
• Price is above the 20-day MA (~66)
• Price is above the 50-day MA (~65)
• Both averages are gradually sloping upward
Interpretation:
• Short-term trend is bullish
• Medium-term trend is bullish
• Moving averages acting as dynamic support
Momentum Indicators: Healthy and Balanced
RSI is currently in the 60–65 range.
Key signals:
• RSI above 50 supports bullish bias
• Not yet overbought
• Indicates room for further upside
Interpretation:
• Momentum is positive but controlled
• No immediate exhaustion signals
• Supports gradual continuation
Volume Analysis: Consistent Participation
Volume trends remain supportive:
• Stable Volume during uptrend
• Occasional spikes during upward moves
• No strong distribution signals
This indicates:
• Steady investor interest
• Lack of aggressive selling
• Trend supported by accumulation
Market Structure: Bullish with Breakout Potential
The broader setup remains constructive:
• Strong recovery from previous lows
• Price nearing resistance zone
• Momentum supportive but not stretched
This suggests:
• Potential breakout above 69
• Continued gradual upside
• Low risk of sharp correction
Key Technical Levels and Scenarios
Support Levels
• 66 as immediate support
• 65 near 50-day Moving Average
• 62–63 as deeper support zone
Resistance Levels
• 68–69 as immediate resistance
• 72 as next upside target
• 75 as extended target
Scenarios
- Bullish Breakout (Primary Case)
• Price breaks above 69
• Momentum strengthens
• Volume expands
• Move toward 72–75 - Consolidation (Secondary Case)
• Price ranges between 65 and 69
• Momentum remains stable
• Base-building before breakout - Mild Pullback (Low Probability Scenario)
• Price slips below 65
• Temporary weakness emerges
• Support near 62–63 holds
Conclusion: Steady Bullish Trend with Breakout Setup
Altria Group is showing a stable and sustainable uptrend supported by healthy momentum and strong Moving Average alignment. With price approaching key resistance and no signs of exhaustion, the stock is well-positioned for a potential breakout, while maintaining a relatively low-risk bullish structure.


 Please wait processing your request...