
Key Highlights
- Arm Holdings has broken above a rising channel, supported by strong volume expansion.
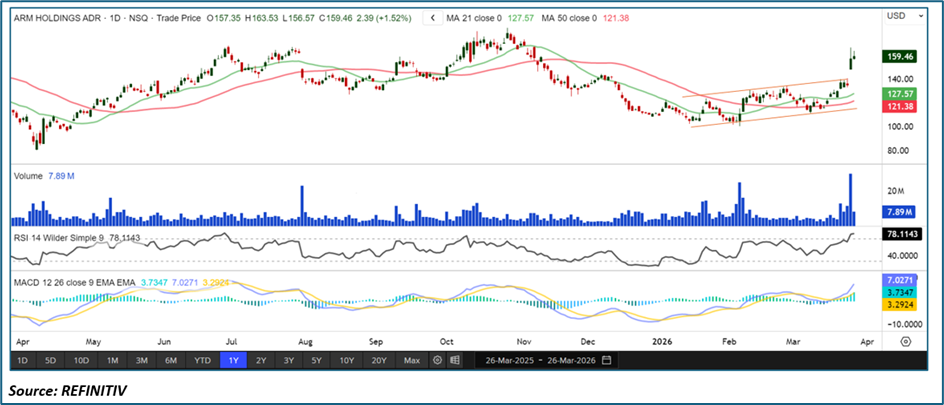
• Price is trading above the 21-period and 50-period simple moving averages, reinforcing a positive trend structure.
• RSI is trending higher, indicating strengthening momentum and sustained buying interest.
• MACD histogram remains in positive territory, supporting the continuation of bullish momentum.
Arm Holdings’ recent price action reflects a notable shift in technical structure, with the stock breaking above a well-defined rising channel. This move, accompanied by strong trading volume, suggests increased market participation and a potential continuation of upward momentum in the near term.
Rising Channel Breakout: Trend Shift and Implications
The prior rising channel represented a steady upward trend, characterized by higher highs and higher lows within a controlled price range. A breakout above this structure typically indicates an acceleration of the prevailing trend rather than exhaustion.
From a technical perspective, such breakouts can imply:
• Strengthening bullish sentiment
• Expansion in price volatility to the upside
• A transition from a gradual uptrend to a more impulsive move
The presence of strong volume during the breakout adds credibility, as it reflects broader market conviction rather than a low-participation move.
Moving Averages: Supportive Trend Alignment
The chart shows the 21-period and 50-period simple moving averages trending below the current price level:
- The 21-period SMA is acting as immediate dynamic support, reflecting short-term strength
• The 50-period SMA reinforces the broader trend, indicating medium-term stability
• The alignment of price above both averages suggests a well-supported bullish structure
This configuration—where shorter-term averages remain above longer-term ones and price stays elevated—typically reflects sustained upward momentum. It also indicates that pullbacks, if any, may find support near these moving averages.
Volume Analysis: Confirmation of Breakout Strength
Volume plays a critical role in validating technical breakouts. In this case:
- The breakout above the rising channel was accompanied by a noticeable increase in volume
• This suggests active participation from institutional and retail market participants
• Sustained higher volume levels could help maintain upward pressure
However, it remains important to observe whether volume continues to support follow-through. Breakouts without consistent volume expansion can sometimes lose momentum.
RSI Momentum: Strengthening Bullish Bias
The Relative Strength Index (RSI) is trending higher and remains above the midpoint level:
- This indicates strengthening bullish momentum
• It reflects increasing buying pressure without immediate signs of overbought conditions
• The upward slope of RSI suggests momentum is building rather than fading
A rising RSI in conjunction with a price breakout often signals alignment between momentum and price action, reinforcing the overall positive bias.
MACD Indicator: Positive Momentum Confirmation
The Moving Average Convergence Divergence (MACD) further supports the current trend:
- The MACD histogram is in positive territory
• This indicates that short-term momentum is outpacing longer-term momentum
• It reinforces the continuation of upward price movement
Positive MACD readings, especially when aligned with price breakouts and rising RSI, strengthen the case for sustained trend momentum, although they do not eliminate the possibility of short-term consolidation.
Market Structure: Momentum-Driven Phase
The current setup suggests that Arm Holdings has entered a momentum-driven phase:
- The breakout signals a shift from steady trend progression to accelerated movement
• Multiple indicators—price, moving averages, RSI, and MACD—are aligned in a positive direction
• The structure reflects increasing confidence among market participants
This phase is often characterized by stronger directional moves, though it may also include brief consolidation periods as the market absorbs gains.
Key Technical Scenarios from Current Levels
Given the current structure, two primary scenarios may unfold:
- Continuation of Uptrend
If price sustains above the breakout level:
• The upward trend may extend further
• Moving averages could continue to act as support zones
• Momentum indicators may remain elevated, supporting continued strength
This scenario would reflect a healthy trend continuation supported by strong technical alignment.
- Retest of Breakout Zone
If short-term consolidation occurs:
• Price may revisit the previous channel resistance (now potential support)
• A successful hold above this level would confirm the breakout
• Failure to hold could lead to temporary weakness or range-bound movement
Retests are common following breakouts and often serve to validate the strength of the new trend structure.
Risk Considerations in the Current Setup
Despite the positive technical signals, certain risks remain:
- Breakouts can sometimes lead to short-term exhaustion, especially after sharp moves
• A decline in volume could weaken the sustainability of the trend
• Broader market conditions, particularly in the semiconductor sector, may influence price behavior
Additionally, rapid upward moves can occasionally lead to consolidation phases, where momentum temporarily slows before the next directional move.
Conclusion: Strength Supported by Multi-Indicator Alignment
Arm Holdings’ technical setup reflects a strong alignment of bullish indicators following a breakout above a rising channel. The combination of price strength, supportive moving averages, rising RSI, and positive MACD suggests a constructive near-term structure.
While the broader trend appears supportive, the sustainability of the move will likely depend on continued volume participation and the ability of price to hold above key breakout levels. The current phase represents a technically significant shift, with momentum indicators reinforcing the underlying strength in price action.


 Please wait processing your request...