
Key Highlights
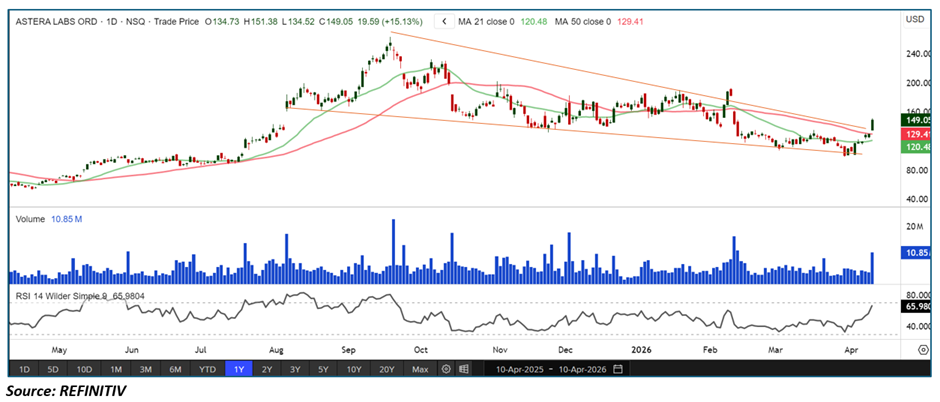
• Astera Labs, Inc. (NASDAQ: ALAB) has broken out of a long-term converging channel, indicating a potential volatility expansion and trend continuation
• Price has moved decisively above the upper boundary of the converging structure with strong bullish intent
• The stock is trading above both the 21-period and 50-period SMAs, which are now acting as dynamic support levels
• The 14-period RSI is in positive territory, reflecting strengthening momentum
• Strong AI-driven demand continues to support long-term growth sentiment
Trend Structure: Converging Channel Breakout Signals Expansion Phase
Astera Labs had been consolidating within a long-term converging channel (symmetrical triangle-type structure), characterized by narrowing price action and compression between lower highs and higher lows. This pattern typically reflects a period of indecision before a major directional move.
The recent breakout above the upper boundary of this converging channel marks a significant technical development, signaling the end of consolidation and the beginning of a potential expansion phase.
Key implications:
• Resolution of prolonged price compression
• Shift from neutral to bullish structure
• Increased probability of directional trend continuation
Such breakouts often lead to sharp moves as volatility expands following a contraction phase.
Price Action: Strong Breakout with Momentum
ALAB has delivered a convincing breakout, supported by a strong bullish candle and follow-through price action. The move indicates aggressive buying and a shift in market sentiment.
Key observations:
• Clear breakout above converging resistance
• Strong bullish price expansion
• Formation of higher highs post-breakout
This type of price behavior suggests institutional participation and increases the likelihood of continued upside momentum rather than immediate reversal.
Moving Average Analysis: Strong Support Structure
The moving average setup is firmly bullish:
• 21-period SMA: Below price, acting as immediate dynamic support
• 50-period SMA: Also below price, reinforcing medium-term support
• Trend implication: Strong bullish alignment
With both key moving averages positioned below the current price, dips toward these levels are likely to attract buying interest. This structure supports the sustainability of the breakout.
Holding above these averages is crucial for maintaining the bullish trend.
RSI Momentum: Positive and Supportive
The Relative Strength Index (RSI) is holding in positive territory above the 50 level, signaling strong and improving momentum.
Current RSI signals:
• Above 50, confirming bullish bias
• Upward slope indicating increasing buying pressure
• Not deeply overbought, leaving room for further upside
A positive RSI during a breakout phase reinforces the probability of continuation, as momentum aligns with price action.
Volume Analysis: Breakout Confirmation
Volume activity has supported the breakout, adding credibility to the move.
Key takeaways:
• Increased volume during breakout phase
• Strong participation from market participants
• Confirms validity of the breakout
Volume-backed breakouts are typically more sustainable and less prone to failure.
Market Structure: Transition from Compression to Expansion
The current setup reflects a classic transition:
• From consolidation (converging channel)
• To expansion (breakout and trend continuation)
This shift is often associated with the start of a new directional move. Additionally, Astera Labs’ positioning in AI infrastructure and rapid revenue growth further supports the bullish narrative.
Key Technical Levels & Targets
- Immediate Resistance: Recent swing highs near breakout extension
• Next Upside Target: Measured move from channel height projected upward
• Immediate Support: 50-period SMA
• Strong Support: 21-period SMA and breakout trendline
Sustaining above the breakout zone remains critical for continuation.
Key Technical Scenarios
- Breakout Continuation (Primary Scenario)
• Price sustains above channel breakout
• RSI remains above 50
• Moving averages act as support
• Continued upside toward higher resistance levels - Pullback and Retest
• Price retraces toward breakout zone or 21-SMA
• Support holds and buyers step in
• Uptrend resumes after consolidation - False Breakout Risk
• Price falls back inside the converging channel
• RSI weakens below 50
• Momentum fades and range returns
Risk Considerations
- Failure to hold above breakout level may invalidate bullish setup
• Short-term consolidation possible after sharp move
• High valuation and volatility typical of AI semiconductor stocks
• Broader market weakness could impact follow-through
Conclusion: Breakout Signals Start of Bullish Expansion Phase
Astera Labs has delivered a technically significant breakout from a long-term converging channel, signaling a shift from consolidation to expansion. The move is supported by strong price action, positive RSI, and a bullish moving average structure, with both the 21- and 50-period SMAs acting as support.
As long as the stock holds above the breakout zone, the technical outlook remains constructive. The combination of structural breakout and strong underlying AI-driven growth trends positions ALAB for potential continuation toward higher levels in the near to medium term.


 Please wait processing your request...