
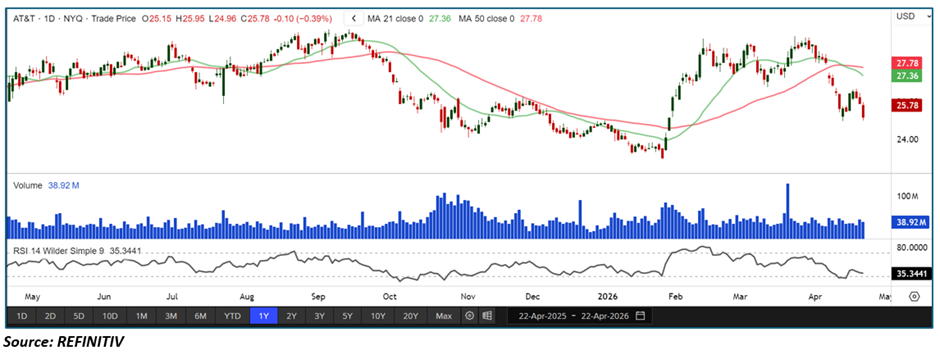
Key Highlights
- AT&T is trading below both the 21-day (~$27.36) and 50-day (~$27.78) moving averages, indicating a weakening trend
• Recent price action shows a sharp rejection from higher levels, followed by a steady decline
• Formation of lower highs and lower lows suggests emerging bearish structure
• RSI near ~35 reflects weak momentum and increasing selling pressure
• Volume shows intermittent spikes, but no sustained accumulation
Trend Structure: Shift from Recovery to Downtrend
AT&T appears to be transitioning from a recovery phase into a short-term downtrend.
Key observations include:
• Strong bounce in February has failed to sustain
• Price structure has shifted to lower highs and lower lows
• Breakdown below key moving averages confirms trend weakness
This suggests the stock is no longer in a recovery phase and is entering a bearish or corrective structure.
Price Action: Sharp Rejection Followed by Sustained Selling
Recent price behavior highlights increasing bearish control:
- Failure near the $28–29 zone (recent swing highs)
• Consistent lower highs indicating supply dominance
• Accelerated decline in recent sessions
This implies:
• Sellers are active on every rally
• Buyers are unable to defend key levels
• Downside momentum is gradually building
Moving Averages: Bearish Positioning Below Key Levels
The moving average structure has turned negative:
- Price is below the 21-day MA (~$27.36)
• Price is below the 50-day MA (~$27.78)
• Both averages are sloping downward and acting as resistance
Interpretation:
• Short-term trend is bearish
• Medium-term structure is weakening
• Any bounce is likely to face resistance near $27–28
Momentum Indicators: RSI Reflects Weakness
RSI is signaling declining strength:
- RSI near ~35, well below neutral 50
• No visible bullish divergence
• Momentum continues to trend downward
Interpretation:
• Selling pressure dominates
• Weak momentum suggests limited upside
• Risk of further downside remains elevated
Volume Analysis: No Clear Accumulation Signal
Volume trends show mixed participation:
- Occasional spikes during declines
• No sustained increase in buying volume
• Lack of strong institutional accumulation
This indicates:
• Selling pressure is more aggressive than buying
• Market participants remain cautious
• No confirmation of reversal yet
Market Structure: Emerging Distribution to Downtrend
The broader structure suggests a distribution phase evolving into a downtrend:
- Prior recovery has failed
• Breakdown below moving averages
• Lower high formation intact
This combination typically signals:
• Transition from accumulation to distribution
• Increased probability of continued downside
• Weak overall trend conviction
ey Technical Levels & Scenarios
Support Levels
- ~$25.50–26.00 (current zone)
• ~$24.50 (next demand zone)
• ~$24.00 (major support area)
Resistance Levels
- ~$27.30 (21-day MA — immediate resistance)
• ~$27.80 (50-day MA — key resistance)
• ~$28.50–29.00 (prior swing highs)
Scenarios
- Bearish Continuation (Primary Case)
• Price remains below 21 & 50 MAs
• RSI stays below 50
• Continued lower highs and lows
• Gradual move toward $24–25 support - Consolidation Phase (Secondary Case)
• Price stabilizes near $25–26
• RSI moves sideways around 35–45
• Reduced volatility
• Temporary base formation - Bullish Reversal (Invalidation Scenario)
• Price reclaims 21-day MA decisively
• Break above 50-day MA with strong volume
• RSI crosses above 50
• Shift back to neutral/bullish structure
Conclusion: Weak Structure with Downside Bias
AT&T is currently exhibiting weak technical structure, with price trading below key moving averages and RSI signaling declining momentum. The breakdown from recent highs and formation of lower highs suggests a shift toward a bearish phase.
Unless the stock reclaims its 21-day and 50-day moving averages with strong buying interest, the path of least resistance remains to the downside, with continued pressure or consolidation likely in the near term.


 Please wait processing your request...