
Key Highlights
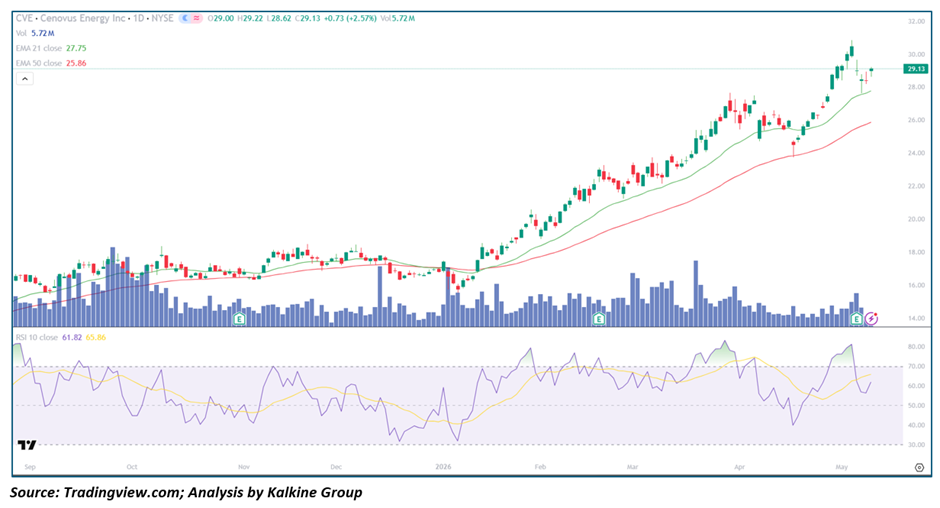
- Cenovus Energy (NYSE: CVE) is advancing to $29.13 (+2.57%), now trading a healthy $1.38 above EMA-21 ($27.75) and $3.27 above EMA-50 ($25.86) — with both EMAs in a firmly bullish rising configuration and price maintaining consistent separation above both averages
- The golden cross alignment is well-established and widening — EMA-21 ($27.75) is meaningfully above EMA-50 ($25.86) with both averages pointing steeply higher, confirming the primary uptrend is intact and strengthening
- RSI-10 at 61.82 with smoothing average at 65.86 — momentum in solidly bullish territory, with the minor RSI dip below its signal line representing a healthy cooling after the recent overbought spike, suggesting a controlled consolidation rather than trend Reversal
- Volume at 5.72M is elevated relative to the baseline seen throughout most of 2025, with a consistent pattern of above-average volume on up days confirming steady institutional participation and accumulation
- An Earnings catalyst (E marker on today's session) appears to be providing fundamental validation for the technical breakout, with price reclaiming the $29+ level last seen only briefly in late April
Trend Structure: Textbook Sustained Uptrend — Seven-Week Bull Phase With No Structural Damage
CVE's technical structure since mid-January 2026 is one of the cleanest and most consistent uptrends visible across the energy sector. From the $17 base established in early January, the stock has mounted a remarkably orderly advance — price consistently riding above both EMAs, pullbacks shallow and brief, and each correction finding buyers well before threatening the Moving Average support. The transition from the flat, directionless trading range of September–December 2025, where price oscillated between $16 and $19 without conviction in either direction, to the sustained January–May 2026 uptrend driven by rising EMAs and higher highs represents a textbook structural evolution from accumulation phase to markup phase. The advance from $17 to $29 — approximately 70% in four months — is substantial but has been achieved in an orderly, technically healthy manner rather than through a speculative vertical spike, making the gains more structurally sustainable.
Price Action: Controlled Breakout to New Highs with Earnings Support
Today's +2.57% session to $29.13 comes after a brief but healthy four-session consolidation between $28 and $30 following the explosive late-April breakout that first carried price above $29. The pattern of the past two weeks — a sharp initial move higher, a tight consolidation just below the highs, and then a renewed push upward on earnings — is a classic bull flag resolution that technically projects further upside. The intraday range of $28.62 to $29.22 shows controlled, deliberate buying rather than panic-driven chasing, and the close near session highs at $29.13 confirms that buyers are maintaining composure and control. The overall candle structure throughout the entire uptrend shows a healthy mix of green and red sessions, with the red sessions consistently characterized by small bodies and limited downside follow-through — a hallmark of a trend where dip buyers are active and confident.
Moving Averages: Golden Cross at Maximum Effectiveness — Rising EMAs as Dynamic Support
The EMA configuration for CVE is as constructive as technically possible for a trending stock. EMA-21 at $27.75 and EMA-50 at $25.86 are separated by a meaningful $1.89 — confirming the golden cross is well-established and not at risk of reversal — and both averages are pointing steeply upward, tracking the price advance in a supportive formation. The $25.86–$27.75 EMA band represents a powerful dynamic support zone that has been tested and respected on multiple occasions during the uptrend's correction phases in February and April. Each time price has pulled back toward the EMAs, buyers have stepped in decisively — validating that the smart money is using these levels as reference points for adding exposure. The EMA structure provides a clear and actionable framework: the $27.75 EMA-21 is the first line of defense on any pullback, and $25.86 EMA-50 is the maximum acceptable Retracement within a healthy continuation of the current trend.
Momentum Indicators: RSI Cooling Constructively — Signal Crossover Suggests Brief Pause Before Resumption
RSI-10 at 61.82 with its smoothing line at 65.86 — with RSI currently just below its signal line — presents a textbook picture of a healthy momentum reset within an ongoing uptrend. The RSI reached the overbought zone near 80 during the late April breakout surge, and the subsequent cooling to 61 over the past week represents exactly the kind of controlled mean-reversion that refreshes momentum without damaging trend structure. Comparing this to the analogous RSI cooling episodes visible in February 2026 and early March — both of which occurred at similar RSI levels and were followed by resumed advances — reinforces the interpretation that the current reading is consolidation within a trend rather than trend reversal. A bullish RSI crossover back above the signal line, which appears imminent given the direction of both lines, would confirm that the pause phase is complete and the next leg higher is beginning.
Volume Analysis: Consistent Accumulation Pattern Throughout the Trend
Volume at 5.72M today is above the recent average and coincides with an earnings event, providing fundamental confirmation of the technical picture. The broader volume pattern throughout the January–May 2026 uptrend is encouragingly consistent — elevated volume on the larger up days, reduced volume on pullback sessions, and periodic spikes on key breakout moments such as the early January launch and the late April acceleration. This pattern is the institutional accumulation signature at its most reliable: funds building positions systematically on strength while allowing price to consolidate on lighter volume before the next advance. The absence of any large-volume down days during the uptrend is particularly noteworthy — it confirms that institutional holders are not distributing into strength and that the Supply overhang that characterized the 2025 trading range has been fully absorbed.
Key Technical Levels and Scenarios
Support Levels
- $28.00–$28.50 — Immediate support (recent consolidation base / bull flag low)
- $27.75 — Critical support (EMA-21; primary trend defense level)
- $25.86 — Major support (EMA-50; maximum healthy pullback target)
Resistance Levels
- $29.22–$29.50 — Immediate resistance (today's intraday high / recent range top)
- $31.00–$32.00 — Near-term target (measured move from bull flag breakout)
- $34.00–$35.00 — Extended bullish target (trend continuation projection)
Scenarios
- Bullish Continuation (Primary Case) — Golden cross intact, RSI cooling constructively, earnings catalyst providing fundamental support — price consolidates briefly in the $28.50–$29.50 range before resuming toward $31–$32 as momentum buyers and fundamental investors add exposure.
- EMA-21 Retest (Secondary Case) — A deeper pullback to the $27.75 EMA-21 zone on reduced volume provides an improved risk/reward entry, with buyers defending the level and the trend resuming — this would be the ideal technical setup for adding to existing positions.
- Trend Invalidation (Low Probability) — A daily close below EMA-50 at $25.86 on elevated volume and negative fundamental follow-through would signal the uptrend is broken — this scenario has no current supporting evidence and would require a significant reversal of the fundamental backdrop driving the advance.
Conclusion: One of the Cleanest Uptrends in the Energy Sector — Bulls Firmly and Sustainably in Control
Cenovus Energy is presenting a technical picture of rare quality — a well-established golden cross uptrend, consistent EMA support through multiple correction phases, controlled RSI momentum that is cooling healthily rather than collapsing, steady institutional accumulation volume, and now an earnings catalyst providing fundamental validation at a new multi-month high. The advance from $17 to $29 has been achieved with textbook technical discipline, and the structure of the current consolidation near the highs strongly suggests it is a pause before continuation rather than a topping process. With EMA-21 at $27.75 as the primary support reference and near-term technical targets pointing toward $31–$32, the risk/reward for bulls remains favorable, and the weight of technical evidence firmly supports the view that CVE's primary trend is up and has further to run.


 Please wait processing your request...