
Key Highlights
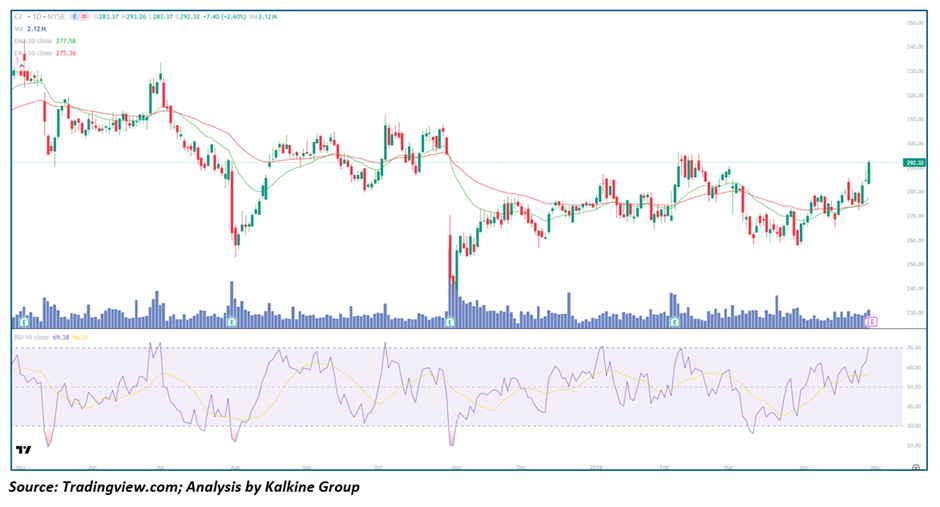
• Cigna (NYSE: CI) is trading above its 20-day (~277.58) and 50-day (~275.36) moving averages, indicating improving trend strength
• Price has broken above the recent resistance zone near 290 with a strong bullish move
• RSI near ~69 suggests strong momentum approaching overbought territory
• Volume has moderately increased during the breakout
• Structure shifting from range-bound to bullish expansion
Trend Structure: Range to Uptrend Transition
CI is moving out of a sideways consolidation into a developing uptrend.
Key observations include:
• Formation of higher lows in recent sessions
• Breakout above prior range highs
• Early signs of higher highs
This suggests:
• Buyers are gaining control
• Consolidation phase is resolving upward
• Trend strength is improving
The structure reflects a breakout from range with bullish continuation potential.
Price Action: Breakout with Positive Follow-Through
Recent price behavior highlights strengthening Demand:
- Strong bullish candles pushing above resistance
• Clean breakout above 285–290 zone
• Follow-through buying with limited selling pressure
This implies:
• Active participation from buyers
• Breakout is gaining traction
• Momentum is building gradually
Such action typically signals:
• Sustained upside potential
• Trend continuation after consolidation
Moving Averages: Bullish Reclaim and Support
The Moving Average structure supports the positive bias:
- Price is above both the 20-day and 50-day MAs
• Short-term average is above medium-term
• Both averages are flattening to slightly upward
Interpretation:
• Short-term trend is bullish
• Medium-term trend is stabilizing
• Moving averages act as support zones
Momentum Indicators: Strong but Not Extreme
RSI is currently near the 65–70 zone.
Key signals:
• RSI approaching overbought levels
• Reflects strengthening momentum
• Still below extreme territory
Interpretation:
• Momentum supports further upside
• Some consolidation may occur
• Trend remains healthy
Volume Analysis: Moderate Participation
Volume trends support the move:
- Slight increase during breakout
• Consistent participation
• No clear signs of heavy distribution
This indicates:
• Buyers are supporting the breakout
• Move has reasonable strength
• Not an overextended Volume spike
Market Structure: Bullish Expansion Phase
The broader structure supports continued upside:
- Breakout from consolidation confirmed
• Price holding above key levels
• Momentum building steadily
This combination suggests:
• Upside continuation likely
• Controlled risk of pullback
• Trend sustainability improving
Key Technical Levels and Scenarios
Support Levels
• 285–280 as immediate support
• 275 near moving averages
• 265 as deeper support
Resistance Levels
• 300 as immediate resistance
• 310 as next upside target
• 325 as extended breakout level
Scenarios
- Bullish Continuation (Primary Case)
• Price holds above 285
• Momentum remains firm
• Volume supports move
• Upside toward 300–310 - Healthy Consolidation (Secondary Case)
• RSI cools slightly
• Price ranges between 275–290
• Buyers defend support
• Uptrend resumes - Pullback Scenario (Low Probability)
• Failure to hold 280
• Price slips below moving averages
• Retest of 265 zone
• Recovery attempt follows
Conclusion: Breakout with Steady Momentum
Cigna is showing a constructive breakout supported by improving momentum and stable Volume. While RSI is nearing overbought levels, the move is not excessively stretched, allowing room for further upside. The stock appears to be entering a bullish expansion phase, with potential for continued gains after brief consolidation.


 Please wait processing your request...