
Key Highlights
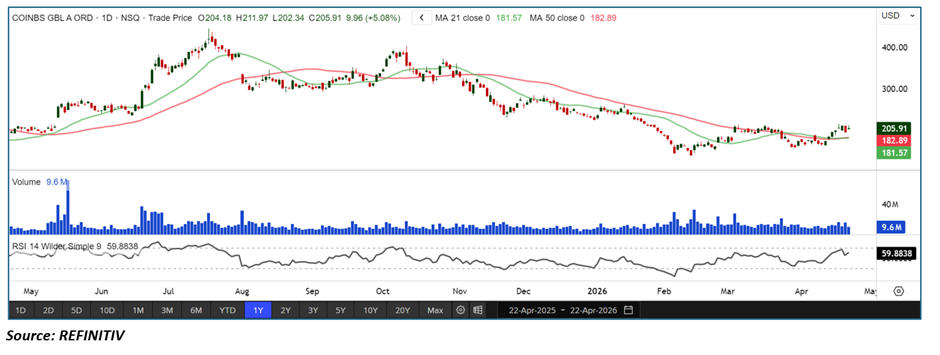
• Coinbase Global (COIN) is trading above both its 21-day (~$181.57) and 50-day (~$182.89) SMAs, signaling bullish trend reversal
• Recent sharp move toward ~$205–210 zone indicates breakout momentum
• RSI near ~60 reflects strengthening bullish momentum without being overbought
• Price action shows higher lows after a prolonged downtrend
• Crypto market rally and rising trading volumes are acting as key catalysts
Trend Structure: Transition from Downtrend to Early Uptrend
COIN is shifting from a bearish phase into a potential recovery trend.
Key observations include:
• Prior downtrend with consistent lower highs now stabilizing
• Formation of a higher low structure in recent weeks
• Break above key moving averages confirming trend shift
This suggests the stock is in the early stages of a trend reversal rather than a mature uptrend.
Price Action: Breakout with Strong Follow-Through
Recent price behavior reflects bullish intent:
• Strong bullish candle pushing above $200
• Break above consolidation range near $190
• Follow-through buying after breakout
This implies:
• Buyers are regaining control
• Momentum traders entering the move
• Potential continuation toward higher resistance zones
Moving Averages: Bullish Reclaim Signals Strength
The moving average structure is improving:
• Price now above the 21-day SMA (~$181.57)
• Price also above the 50-day SMA (~$182.89)
• Both averages beginning to flatten/turn upward
Interpretation:
• Short-term trend has turned bullish
• Medium-term downtrend weakening
• Moving averages now acting as support
Momentum Indicators: RSI Shows Controlled Strength
RSI is supporting the bullish case:
• RSI around ~59–60 (above neutral 50)
• No overbought conditions yet
• Momentum gradually building
Interpretation:
• Healthy bullish momentum
• Room for further upside
• No immediate exhaustion signal
Volume Analysis: Participation Expanding
Volume trends confirm the move:
• Increased volume during recent upside breakout
• Prior accumulation phase visible
• No major distribution signals
This indicates:
• Institutional participation likely increasing
• Breakout has stronger credibility
• Trend continuation possible
Market Structure: Crypto Tailwinds Driving Sentiment
The broader setup is heavily influenced by macro and sector dynamics:
• Bitcoin and crypto markets rallying, boosting trading activity
• Coinbase benefiting from higher transaction volumes and ETF custody flows
• Stock recently surged ~26% in a short span, reflecting strong momentum
However, risks remain:
• Regulatory uncertainty (e.g., lawsuits around prediction markets)
• High sensitivity to crypto price volatility
ey Technical Levels & Scenarios
Support Levels
• ~$190 (recent breakout zone)
• ~$182 (21 & 50-day SMA confluence — key support)
• ~$170 (previous base zone)
Resistance Levels
• ~$210 (near-term resistance)
• ~$230–240 (next major supply zone)
Scenarios
- Bullish Continuation (Primary Case)
• Price holds above $190
• RSI moves toward 65–70
• Upside toward $220–240 - Pullback & Retest (Healthy Case)
• Dip toward $185–190
• Support holds at moving averages
• Continuation after consolidation - Failed Breakout (Risk Scenario)
• Break below $180
• RSI falls below 50
• Return to sideways or bearish structure
Conclusion: Recovery Momentum Building with Crypto-Driven Upside Potential
Coinbase is showing clear signs of a technical recovery, supported by improving price structure, rising momentum, and strong crypto market tailwinds. The reclaim of key moving averages and breakout above $200 strengthens the bullish case.
However, given the stock’s high sensitivity to crypto cycles and regulatory developments, volatility is likely to remain elevated. As long as price sustains above the $180–190 support zone, the outlook remains bullish with potential for further upside expansion.


 Please wait processing your request...