
Key Highlights
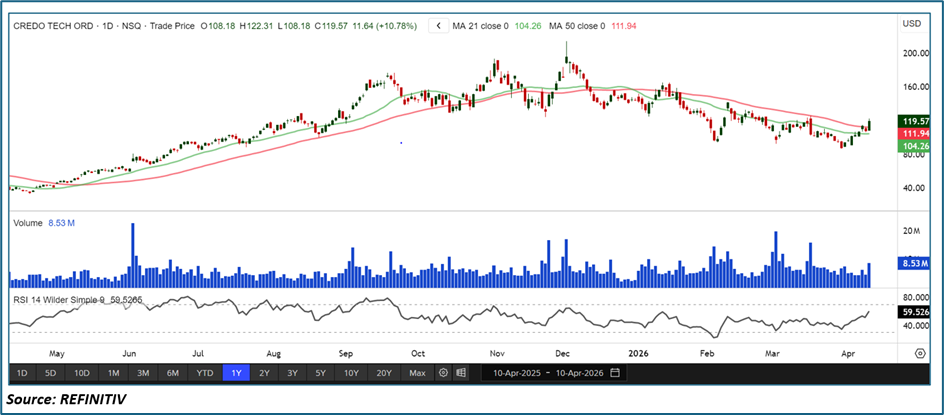
• Credo Technology Group Holding Ltd. (NASDAQ: CRDO) has reclaimed both the 21-period and 50-period SMAs, signaling strengthening bullish structure
• Price is now holding above both moving averages, which may act as dynamic support on pullbacks
• The stock is approaching a potential golden crossover, indicating a possible medium-term trend reversal
• The 14-period RSI is in positive territory, reflecting improving momentum
• Broader technical indicators are turning bullish, with multiple buy signals across moving averages
Trend Structure: Reclaiming Moving Averages Signals Trend Shift
Credo Technology had previously experienced a corrective phase, trading below key moving averages and reflecting bearish pressure. However, the recent price action shows a clear structural improvement.
The stock has now regained both the 21-period and 50-period SMAs, which is a critical signal that trend direction may be shifting.
Key implications:
• Transition from correction to recovery phase
• Buyers regaining control above key levels
• Early-stage formation of a bullish trend
This reclaiming phase often precedes stronger upside moves, especially when followed by a golden crossover.
Price Action: Strength Above Key Levels
CRDO’s price action reflects strengthening bullish sentiment, with price sustaining above both short- and medium-term averages.
Key observations:
• Strong move above 21-SMA and 50-SMA
• Higher low formation indicating improving structure
• Price holding above support levels
Such behavior suggests accumulation and growing confidence among buyers. The ability to hold above these levels will be crucial for continuation.
Moving Average Analysis: Golden Crossover Setup
The moving average structure is turning decisively bullish:
• 21-period SMA: Below price, acting as immediate support
• 50-period SMA: Also below price, reinforcing support
• Golden crossover setup: Short-term average approaching crossover above medium-term average
This setup is important because:
• A golden crossover typically signals the start of a sustained uptrend
• Moving averages below price create a support cushion
• Trend confirmation strengthens once crossover is completed
If the crossover materializes, it could act as a strong technical confirmation for further upside.
RSI Momentum: Positive and Strengthening
The Relative Strength Index (RSI) is currently in positive territory, supporting the bullish outlook. Recent readings show RSI above 50, indicating a “buy” signal in technical models .
Current RSI signals:
• Above 50, confirming bullish momentum
• Gradual upward slope indicating strengthening demand
• Not overbought, leaving room for further upside
A positive RSI aligned with price above moving averages strengthens the probability of continuation.
Volume & Momentum Indicators: Broad-Based Strength
Momentum indicators are increasingly supportive of the bullish case:
• Multiple moving averages flashing buy signals
• MACD and oscillators turning positive in recent readings
• Improving participation suggesting accumulation
This confluence of signals indicates that the current move is not isolated but supported across multiple technical dimensions.
Market Structure: Early Stage of Bullish Continuation
The current setup reflects a transition phase:
• From weakness → stabilization → early uptrend
• Price reclaiming key technical levels
• Momentum indicators turning positive
Historically, such setups—especially when combined with a golden crossover—can lead to sustained directional moves.
Additionally, strong demand for AI-driven connectivity solutions continues to support the company’s broader growth narrative, with significant revenue expansion driven by hyperscaler demand .
Key Technical Levels & Targets
- Immediate Resistance: Recent swing highs near short-term peaks
• Next Upside Target: Prior resistance zones and potential breakout levels
• Immediate Support: 21-period SMA
• Strong Support: 50-period SMA
Holding above these support levels is critical to maintain bullish momentum.
Key Technical Scenarios
- Golden Crossover Confirmation (Primary Scenario)
• 21-SMA crosses above 50-SMA
• RSI remains above 50
• Price sustains above both averages
• Continuation toward higher resistance levels - Pullback to Support
• Price retraces toward 21-SMA or 50-SMA
• Support holds and buyers re-enter
• Uptrend resumes after consolidation - Failed Setup
• Price falls back below moving averages
• RSI weakens below 50
• Momentum fades and structure weakens
Risk Considerations
- Failure to hold above 21- and 50-SMAs may invalidate bullish structure
• Golden crossover is not yet confirmed—still a developing setup
• Short-term volatility may increase near resistance zones
• Broader market weakness could impact momentum
Conclusion: Reclaiming Key Averages Sets Stage for Bullish Continuation
Credo Technology has shown a notable improvement in technical structure by reclaiming both the 21- and 50-period SMAs. With both averages now acting as support and RSI in positive territory, the stock is building a strong foundation for further upside.
The developing golden crossover setup is a key signal to watch, as it could confirm a transition into a sustained bullish trend. If price continues to hold above these levels, CRDO appears well-positioned for continuation toward higher resistance zones, reinforcing a constructive near- to medium-term outlook.


 Please wait processing your request...