
Key Highlights
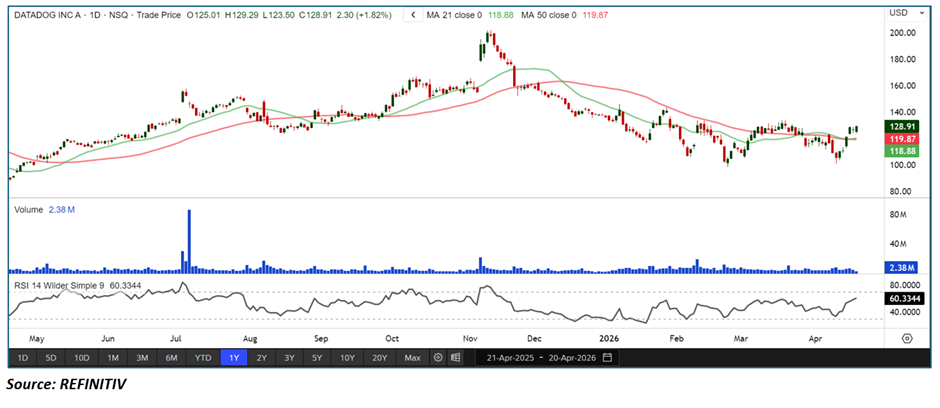
- Datadog (NASDAQ: DDOG) is stabilizing after a prolonged downtrend from late 2025 highs
• Price has reclaimed both the 21-period and 50-period SMAs, indicating improving trend strength
• A base appears to be forming in the $110–$120 zone
• RSI is rising toward bullish territory, reflecting strengthening momentum
• Volume remains moderate, supporting a steady—not speculative—recovery
 Trend Structure: From Downtrend to Stabilization
DDOG appears to be transitioning from a clear downtrend into a stabilization phase.
Key observations include:
• Series of lower highs slowing down
• Price holding above recent swing lows
• Formation of a potential base structure
This suggests the bearish momentum is fading, with early signs of accumulation emerging.
Price Action: Signs of Base Formation
Recent price behavior indicates improving sentiment:
• Bounce from the ~$105–$110 demand zone
• Gradual formation of higher lows
• Break above short-term resistance zones
This implies:
• Selling pressure is diminishing
• Buyers are stepping in at lower levels
• Probability of a trend transition is increasing
Moving Averages: Reclaim of 21 & 50 SMA Signals Shift
The moving average structure is turning constructive:
• Price has moved above the 21-period SMA (~$118.88)
• Price has reclaimed the 50-period SMA (~$119.87)
• Short-term averages are beginning to flatten
When price sustains above these levels:
• It signals a shift toward a neutral-to-bullish bias
• Moving averages can act as dynamic support on pullbacks
Momentum Indicators: RSI Moving Toward Strength
RSI is showing improving momentum:
• RSI is around 60, indicating bullish momentum building
• Reflects increasing buying pressure
• No bearish divergence visible
Interpretation:
• Momentum supports continued upside
• Room remains before overbought conditions
• Trend can strengthen further if RSI sustains above 60
Volume Analysis: Moderate but Supportive
Volume trends indicate:
• Steady participation during the recovery phase
• No major spikes, suggesting controlled accumulation
• Lack of panic selling at recent lows
This supports the idea of a sustainable recovery rather than a short-lived bounce.
Market Structure: Early Recovery Phase
The overall structure reflects a potential transition:
• Downtrend losing strength
• Base forming near recent lows
• Reclaim of key technical levels
This typically signals:
• Shift from distribution to accumulation
• Early stage of a recovery cycle
Key Technical Levels & Scenarios
Support Levels
- $120 zone (immediate support)
• 21-period SMA (~$118.88)
• 50-period SMA (~$119.87)
Resistance Levels
- $135–$140 (near-term resistance)
• $150+ (major resistance from prior breakdown)
Scenarios
- Bullish Continuation (Primary Case)
• Price holds above $120
• Sustains above 21 & 50 SMA
• Break above $135–$140
• Continuation toward higher resistance levels - Healthy Consolidation (Secondary Case)
• Sideways movement near current levels
• RSI remains between 50–65
• Moving averages act as support
• Base strengthens before next move - Bearish Reversal (Invalidation Scenario)
• Price falls below $118
• Break below 50 SMA
• RSI drops below 45–50
• Weakens recovery structure
Conclusion: Stabilization with Recovery Potential
Datadog is showing early signs of recovery after an extended decline, with price reclaiming key moving averages and forming a base near recent lows.
Momentum is improving without being overheated, and volume supports a gradual accumulation phase.
As long as DDOG holds above the $118–$120 zone and maintains support at the 21 and 50 SMAs, the outlook favors continued stabilization with potential for an upside breakout in the coming sessions.


 Please wait processing your request...