
Key Highlights
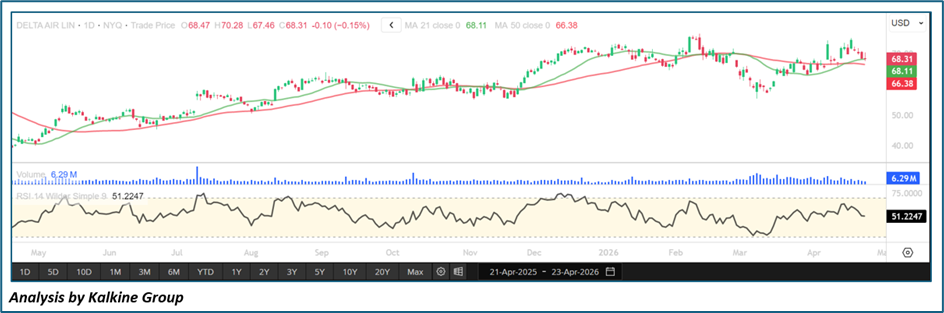
• Delta Air Lines is trading near its 21-day (~$68.11) and 50-day (~$66.38) moving averages, reflecting a neutral trend setup
• Price action has turned choppy after a prior uptrend, indicating consolidation
• Recent highs are not significantly expanding, suggesting slowing bullish momentum
• RSI near ~51 signals balanced momentum with no strong directional bias
• Volume remains stable without strong accumulation or distribution signals
Trend Structure: Uptrend Transitioning into Consolidation Phase
Delta Air Lines appears to be moving out of a prior uptrend into a more range-bound structure. While the broader trend had been positive, recent price behavior suggests a slowdown in momentum.
Key observations include:
• Earlier higher highs and higher lows are now flattening
• Price structure is becoming more horizontal
• Momentum is no longer trending strongly upward
This shift typically indicates:
• A pause in trend continuation
• Market participants reassessing valuation
• Potential buildup for the next directional move
The current structure suggests consolidation rather than immediate reversal, but weakening momentum raises caution.
Price Action: Choppy Movement Reflects Indecision
Recent price behavior shows a lack of clear directional conviction:
- Price is oscillating within a defined range
• Upside attempts are facing mild resistance near recent highs (~$70–71 zone)
• Pullbacks are finding support near moving averages
This implies:
• Buyers are still present but not aggressive
• Sellers are stepping in near resistance levels
• Market is in equilibrium between demand and supply
Such choppy movement often precedes:
• A breakout (if accumulation occurs)
• Or a breakdown (if support weakens)
At this stage, Delta is neither strongly bullish nor bearish.
Moving Averages: Neutral Setup with Slight Support Bias
The moving average structure reflects a stabilizing trend:
- Price is slightly above the 50-day MA (~$66.38)
• Price is hovering around the 21-day MA (~$68.11)
• Both averages are relatively flat
Interpretation:
• Short-term trend is neutral
• Medium-term trend remains mildly supportive
• No strong trend confirmation in either direction
If price sustains above both averages:
• It may act as dynamic support
However, a breakdown below these levels could:
• Trigger short-term bearish momentum
• Shift sentiment toward caution
Momentum Indicators: RSI Suggests Balanced Conditions
The Relative Strength Index (RSI) is currently near ~51, indicating a neutral momentum profile.
Key signals:
• RSI is close to the midpoint (50)
• No overbought or oversold conditions
• No clear divergence patterns
Interpretation:
• Momentum is balanced between buyers and sellers
• No strong directional edge
• Consolidation likely to continue unless momentum expands
For bullish confirmation:
• RSI needs to move above 55–60
For bearish confirmation:
• RSI falling below 45 would signal increasing selling pressure
Volume Analysis: Lack of Strong Institutional Conviction
Volume trends remain steady but unremarkable:
- No significant spikes indicating aggressive buying
• Selling pressure is not dominant
• Participation appears moderate
This indicates:
• Institutional activity is relatively neutral
• No clear accumulation phase
• Breakout or breakdown lacks confirmation
Without strong volume expansion:
• Price is likely to remain range-bound
Market Structure: Consolidation with Balanced Risk
The broader technical structure suggests a consolidation phase:
- Uptrend momentum has slowed
• Price is stabilizing near key averages
• Range formation is becoming clearer
This combination typically signals:
• A pause before the next directional move
• Market waiting for a catalyst (earnings, macro, fuel prices)
• Equal probability of breakout or breakdown
Key Technical Levels & Scenarios
Support Levels
- ~$66–67 (50-day MA support zone)
• ~$64 (secondary support)
• ~$60 (major demand zone)
Resistance Levels
- ~$70–71 (near-term resistance)
• ~$73 (recent swing high)
• ~$75+ (breakout zone)
cenarios
- Range Consolidation (Primary Case)
• Price remains between $66–71
• RSI stays around 45–55
• Volume remains moderate
• Continued sideways movement - Bullish Breakout (Secondary Case)
• Price breaks above $71–73 resistance
• Volume expansion confirms buying
• RSI moves above 60
• Upside toward $75+ levels - Bearish Breakdown (Risk Scenario)
• Price falls below $66 support
• RSI drops below 45
• Selling pressure increases
• Move toward $64–60 zones
Conclusion: Neutral Momentum with Range-Bound Bias
Delta Air Lines is currently exhibiting a balanced technical setup, with price consolidating near key moving averages and RSI reflecting neutral momentum. The prior uptrend has lost strength, but there is no clear evidence of a reversal yet.
The stock appears to be in a wait-and-watch phase, with neither bulls nor bears in full control. Unless a strong catalyst emerges, the most likely near-term outcome is continued range-bound movement.
A decisive move above resistance or below support, supported by volume and momentum, will be key in determining the next directional trend.


 Please wait processing your request...