
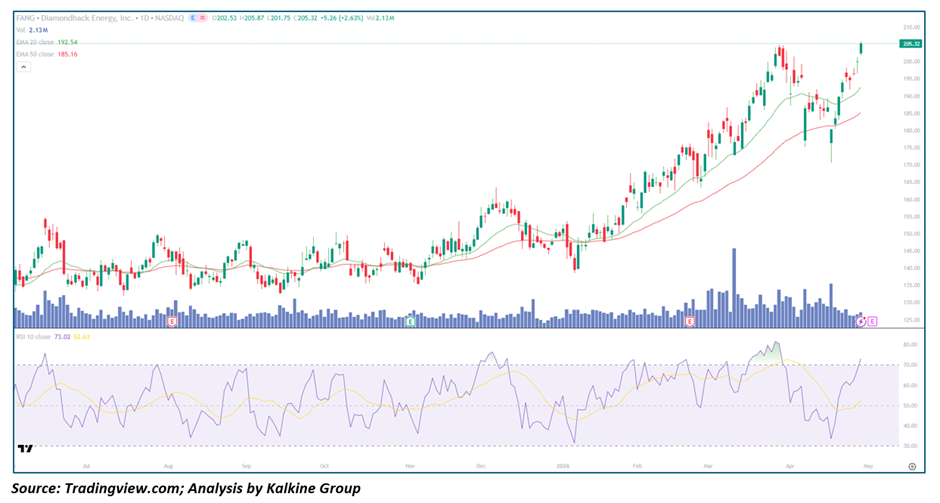
Key Highlights
• Diamondback Energy is trading well above its 20-day (~$192.54) and 50-day (~$185.16) moving averages, confirming a strong bullish trend
• Price has recently broken out toward the $200–$205 zone, establishing fresh swing highs
• RSI is near ~73, indicating strong momentum with early overbought conditions
• Volume has expanded during the recent rally, supporting breakout strength
• Price structure reflects higher highs and higher lows, signaling sustained buyer control
Trend Structure: Strong Uptrend with Accelerating Momentum
Diamondback Energy is currently exhibiting a powerful bullish trend characterized by a clear sequence of higher highs and higher lows. The stock has transitioned from a gradual uptrend into a more accelerated phase, as evidenced by the recent sharp move toward the $200+ zone. This type of price behavior typically indicates strong institutional participation and increasing market confidence.
The breakout above prior resistance near $195–$200 marks a significant technical development. This level had previously acted as a Supply zone, and the successful move above it suggests that buyers have absorbed selling pressure. The current structure reflects trend continuation rather than exhaustion, although short-term cooling may occur due to stretched momentum.
Price Action: Breakout Follow-Through with Minor Consolidation Risk
Recent price action shows a decisive breakout followed by continuation toward new highs. The candles near the highs are relatively strong, with limited upper wicks, indicating that sellers are not aggressively rejecting higher prices.
However, after such a sharp move, the probability of short-term consolidation or a mild pullback increases. This does not necessarily indicate weakness but rather a natural pause within a strong trend. If the price begins to move sideways above the breakout zone, it would further strengthen the bullish case by forming a continuation base.
Moving Averages: Bullish Alignment and Dynamic Support
The 20-day and 50-day moving averages are both sloping upward, confirming strong trend alignment. The price trading significantly above these averages reflects strong momentum and trend extension.
- The 20-day EMA (~$192.54) serves as immediate dynamic support
• The 50-day EMA (~$185.16) provides a stronger medium-term support base
The widening gap between the price and moving averages indicates an extended move, which often leads to either consolidation or a pullback toward these support levels. Importantly, any Retracement toward the 20-day EMA would likely attract buyers if the trend remains intact.
Momentum Indicators: RSI in Overbought Territory with Strength Intact
The Relative Strength index (RSI) is currently around 73, placing it in overbought territory. While this may raise concerns about a potential pullback, it is important to note that in strong trending markets, RSI can remain elevated for extended periods.
Key observations:
• RSI reflects strong buying pressure
• No clear bearish divergence is visible
• Momentum remains supportive of the trend
This suggests that while short-term cooling is possible, the broader momentum remains bullish unless divergence or sharp Reversal signals emerge.
Volume Analysis: Breakout Supported by Participation
Volume has shown noticeable expansion during the recent upward move, which adds credibility to the breakout. Increased Volume during rallies typically indicates institutional buying and strengthens the sustainability of the move.
During minor pullbacks, Volume appears relatively controlled, suggesting that selling pressure is not aggressive. This pattern supports the view that the current trend is driven by accumulation rather than speculation.
Market Structure: Bullish with Continuation Bias
The overall market structure for Diamondback Energy remains strongly bullish. The combination of breakout price action, Moving Average alignment, and supportive momentum indicators suggests continuation rather than Reversal.
Key structural elements:
• Established uptrend with higher highs and higher lows
• Breakout above key resistance zone
• Strong momentum and Volume confirmation
This positions the stock in a favorable technical setup for further upside, provided key support levels hold.
Key Technical Levels and Scenarios
Support Levels
• $200–$198 as immediate support (recent breakout zone)
• $192–$193 near the 20-day EMA
• $185 near the 50-day EMA
Resistance Levels
• $205–$210 as near-term resistance/extension zone
• Above $210 could open room for further upside expansion
Scenarios
- Trend Continuation (Primary Case)
• Price holds above $198–$200
• RSI remains elevated but stable
• Gradual move toward $210+ levels - Consolidation Phase (Secondary Case)
• Price moves sideways near highs
• Formation of a flag or range pattern
• Momentum resets before next leg higher - Pullback Within Uptrend (Healthy Correction)
• Price retraces toward $192–$195
• Buyers step in near 20-day EMA
• Trend resumes after correction
Conclusion: Strong Bullish Trend with Short-Term Cooling Risk
Diamondback Energy remains in a strong uptrend supported by breakout price action, rising moving averages, and robust momentum. While the RSI suggests near-term overbought conditions, this is typical in strong trends and does not immediately signal Reversal.
As long as the stock holds above the $198–$200 zone, the bullish structure remains intact. Short-term consolidation or pullbacks should be viewed within the context of a broader uptrend. A sustained move above $205 could further accelerate upside momentum, reinforcing the continuation of the current bullish phase.


 Please wait processing your request...