
Key Highlights
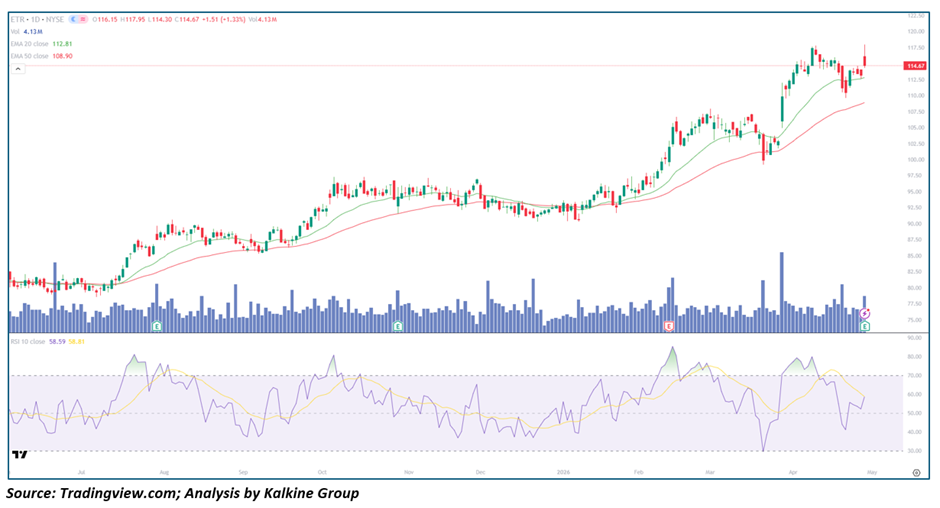
• Entergy is trading comfortably above its 21-day (~$112.81) and 50-day (~$108.90) moving averages, reinforcing a sustained bullish structure
• Price action continues to form higher highs and higher lows, indicating a healthy uptrend remains intact
• Recent consolidation near resistance reflects strength rather than weakness, suggesting accumulation
• RSI near ~58 signals balanced momentum with room for further upside before overbought conditions
Trend Structure: Consistent Higher Lows Indicate Strong Buyer Control
Entergy Corporation is currently displaying a well-organized uptrend characterized by a sequence of higher lows and higher highs. This structure is one of the most reliable indicators of sustained bullish momentum, as it reflects consistent Demand entering the stock at progressively higher price levels. Unlike volatile breakout-driven rallies, Entergy’s price movement appears more measured and controlled, suggesting institutional participation rather than speculative buying.
The recent price action shows a consolidation phase just below the $118–$120 resistance zone. This type of sideways movement after an upward leg is typically viewed as a continuation pattern, where the market pauses to absorb Supply before attempting another breakout. Importantly, the pullbacks during this phase have been shallow, indicating that sellers are not aggressive and buyers continue to defend key levels.
Moving Averages: Strong Dynamic Support Zones
The 21-day and 50-day exponential moving averages are both trending upward, confirming alignment with the broader bullish trend. The price consistently staying above these levels highlights their role as dynamic support zones. The 21-day EMA, currently near $112.81, is acting as immediate support, catching short-term pullbacks and allowing the stock to maintain upward momentum.
Meanwhile, the 50-day EMA around $108.90 serves as a more significant support level that defines the medium-term trend. The widening gap between the 21-day and 50-day EMAs suggests increasing bullish momentum and a strengthening trend. As long as the price remains above these moving averages, the probability of continued upside remains high.
Momentum Indicators: RSI Suggests Healthy Trend Continuation
The Relative Strength index (RSI) is currently around 58, which places it in a neutral-to-bullish range. This is an encouraging signal for trend continuation, as it indicates that the stock is not in overbought territory and still has room to move higher. In strong uptrends, RSI often oscillates between 50 and 70, and Entergy appears to be following this pattern.
Additionally, there are no clear signs of bearish divergence, where price makes higher highs but RSI fails to do so. The absence of such divergence further strengthens the case for continued upward movement. The recent cooling of RSI from higher levels can also be interpreted as a reset in momentum, allowing the next potential rally to develop on a stronger base.
Volume Analysis: Stable Participation Supports the Trend
Volume patterns in Entergy remain relatively stable, with occasional spikes during upward price movements. This indicates that buying interest tends to increase during rallies, a positive sign for trend sustainability. Importantly, there is no evidence of heavy selling Volume during pullbacks, which suggests that the declines are more likely due to profit-taking rather than a shift in market sentiment.
The steady Volume profile aligns well with the overall structure of a controlled uptrend, where accumulation occurs gradually rather than through sudden bursts of activity.
Support and Resistance Levels: Key Zones to Watch
From a technical standpoint, the $112–$113 region represents immediate support, aligning closely with the 21-day EMA. A successful hold above this level would reinforce the short-term bullish structure. Below that, the $108–$110 zone, corresponding to the 50-day EMA, serves as a strong support area that could attract buyers in the event of a deeper pullback.
On the upside, the $118–$120 range acts as a critical resistance zone. This level has capped recent advances, making it an important breakout point. A decisive move above $120, especially with strong Volume, could signal the start of a new leg higher and potentially lead to fresh highs.
Outlook: Bullish Continuation with Breakout Potential
Overall, Entergy Corporation remains firmly positioned within a bullish trend, supported by strong price structure, upward-sloping moving averages, and healthy momentum indicators. The ongoing consolidation near resistance should not be interpreted as weakness; rather, it appears to be a constructive phase that could precede further upside.
As long as the stock maintains its position above the 21-day EMA, the trend remains intact, and dips are likely to be viewed as buying opportunities. A breakout above the $120 resistance level would act as a confirmation of bullish continuation, potentially attracting additional momentum-driven buyers.
However, traders should also monitor for any signs of weakness, particularly a breakdown below the 50-day EMA, which could indicate a shift in trend dynamics. Until such signals emerge, the overall bias for Entergy remains positive, with a strong probability of continued upward movement in the near to medium term.


 Please wait processing your request...