
Highlights
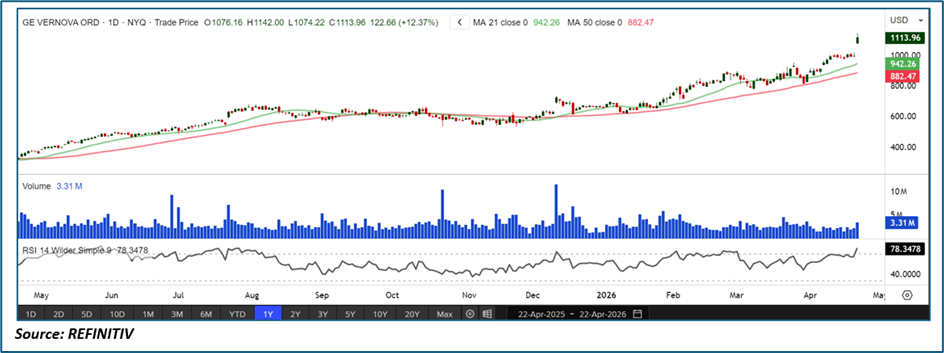
- GE Vernova is trading well above both the 21-day (~$942.26) and 50-day (~$882.47) moving averages, signaling strong trend strength
• Price has delivered a sharp breakout to new highs, confirming bullish continuation
• Higher highs and higher lows structure firmly intact
• RSI near ~78 indicates strong momentum, though approaching overbought levels
• Volume remains supportive, with periodic spikes confirming buying interest
Trend Structure: Sustained Uptrend with Acceleration Phase
GE Vernova is in a well-established bullish trend, now entering an acceleration phase.
Key observations include:
• Consistent formation of higher highs and higher lows
• Trend strength improving over recent months
• Breakout above prior resistance zones
This suggests the stock is not just trending higher but gaining momentum, typical of a strong bullish continuation phase.
Price Action: Breakout with Strong Follow-Through
Recent price behavior reflects aggressive bullish control:
- Clean breakout above the $1000 psychological level
• Strong bullish candles with minimal pullbacks
• Sustained follow-through after breakout
This implies:
• Buyers are in full control
• Demand is overwhelming supply
• Momentum-driven rally is underway
Moving Averages: Strong Bullish Alignment
The moving average structure is highly constructive:
- Price is above the 21-day MA (~$942.26)
• Price is above the 50-day MA (~$882.47)
• Both averages are sloping upward
Interpretation:
• Short-term trend is strongly bullish
• Medium-term trend is firmly positive
• Moving averages are acting as dynamic support zones
Momentum Indicators: RSI Signals Strong but Extended Momentum
RSI is reflecting powerful momentum:
- RSI near ~78, entering overbought territory
• No immediate bearish divergence visible
• Momentum remains strong
Interpretation:
• Strong buying pressure persists
• Trend continuation likely in the near term
• However, risk of short-term pullback or consolidation is rising
Volume Analysis: Supportive but Not Climax-Driven
Volume trends indicate healthy participation:
- Periodic spikes confirm institutional activity
• No extreme blow-off volume yet
• Participation remains consistent
This indicates:
• Rally is supported by real demand
• No signs of exhaustion yet
• Trend remains sustainable in the near term
Market Structure: Markup Phase in Progress
The broader structure reflects a classic bullish markup phase:
- Strong uptrend with acceleration
• Breakout from consolidation zones
• Continuation pattern unfolding
This combination typically signals:
• Institutional accumulation transitioning into markup
• Increased upside potential
• Trend-following environment
Key Technical Levels & Scenarios
Support Levels
- ~$1000–1020 (recent breakout zone)
• ~$940 (21-day MA — dynamic support)
• ~$880 (50-day MA — major support)
Resistance Levels
- ~$1150 (near-term extension zone)
• Higher levels remain open due to price discovery
Scenarios
- Bullish Continuation (Primary Case)
• Price holds above $1000 breakout zone
• RSI remains above 60
• Higher highs structure continues
• Further upside toward $1150+ - Consolidation / Pullback (Secondary Case)
• Short-term pullback toward $940–1000
• RSI cools from overbought levels
• Sideways consolidation before next leg higher - Bearish Reversal (Invalidation Scenario)
• Breakdown below 21-day MA
• Loss of $940 support
• RSI drops below 50
• Structure shifts to neutral
Conclusion: Strong Uptrend with Near-Term Extension Risk
GE Vernova is exhibiting strong bullish momentum, supported by a breakout structure, rising moving averages, and solid volume participation. The stock is clearly in a markup phase, with buyers firmly in control.
However, with RSI approaching overbought levels, short-term consolidation or pullbacks are possible. Unless price breaks below key support levels, the overall trend remains decisively bullish, with further upside potential in the near term.


 Please wait processing your request...