
Key Highlights
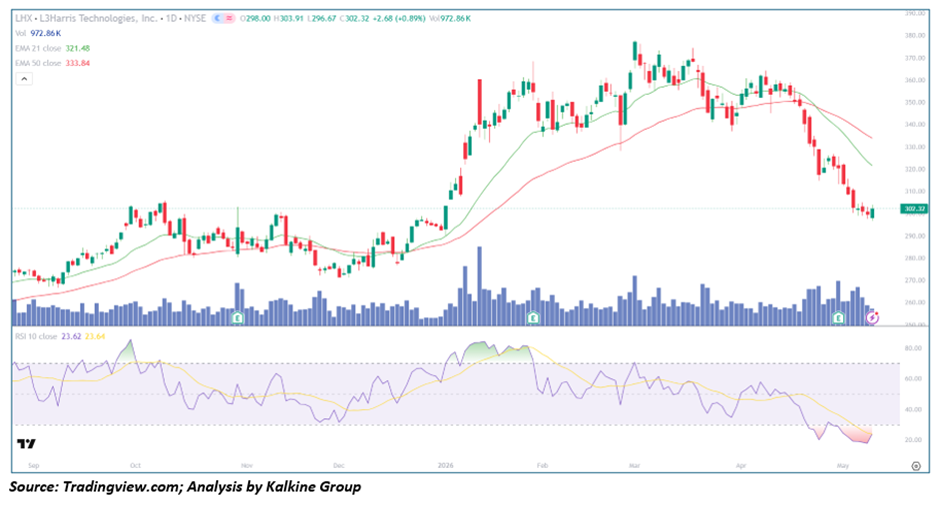
- L3Harris (NYSE: LHX) is sliding to $302.32 (+0.89%) on the day, but remains down a severe ~$70 from its $370+ peak in February 2026 — erasing nearly 19% of Market Value in under three months
- Price is trading $19 below EMA-21 ($321.48) and $31 below EMA-50 ($333.84), with both MAs sloping aggressively downward in a confirmed Death Cross alignment
- RSI-10 at 23.62 with smoothing average at 23.64 — deeply entrenched in oversold territory, with the red shaded zone representing the most extreme selling episode visible across the entire chart's history
- Volume at 972.86K is elevated and among the highest readings in recent months, pointing to active institutional distribution rather than retail-driven panic
- Structure has completely broken down with price printing multi-month lows — the $300 psychological support is now under direct threat with no meaningful floor visible below
Trend Structure: Full Bear Phase Confirmed — Distribution Ongoing and Systematic
LHX enjoyed a powerful bull run from the September 2025 lows near $265 all the way to the February 2026 peak above $370, supported by both EMAs in a clean uptrend. However, the decisive rejection at those highs and subsequent break below the EMA-50 in March 2026 marked the beginning of a structural collapse that has accelerated sharply into May. The stock has now surrendered the entire December–February rally, with price falling back to levels last seen in late 2025. Each attempted recovery since March has been met with aggressive selling, printing a clear sequence of lower highs and lower lows that defines a confirmed bear phase. There is no visible base formation, no accumulation pattern, and no sign that the selling pressure is abating — the trend is firmly and fully bearish.
Price Action: Waterfall Decline With $300 Psychological Support Under Siege
The most concerning feature of LHX's current price action is the sheer velocity of the decline — from $370 to $302 in roughly ten weeks represents an almost uninterrupted waterfall move dominated by large red candles and shallow, unconvincing bounces. The $310–$315 zone, which briefly offered support in late April, has now been decisively violated, and today's session, while mildly positive, shows only a modest +0.89% recovery after touching an intraday low of $296.67 — a clear sign that buyers lack conviction. The $300 round number is now the last visible psychological support on the chart, and a confirmed daily close below it would open a technical vacuum toward the $280–$285 area where the stock consolidated in the October–November 2025 period.
Moving Averages: Death Cross Entrenched — Both EMAs Firmly Overhead as Resistance
The EMA structure for LHX is unambiguously bearish. With price at $302.32 sitting $19.16 below EMA-21 ($321.48) and $31.52 below EMA-50 ($333.84), both averages are pointing sharply lower and the gap between price and the EMAs continues to widen — indicating the rate of decline is outpacing even the falling moving averages. The death cross is firmly confirmed, and both EMAs now represent formidable overhead resistance. Reclaiming EMA-21 alone would Demand a +6.3% rally from current levels, a move that would require substantial fundamental catalysts and institutional buying conviction — neither of which is currently visible in the price or volume data.
Momentum Indicators: Historic Oversold Reading — But No Bullish Crossover Yet
RSI-10 at 23.62 with its smoothing line at 23.64 places LHX in the most extreme oversold condition visible across the entire twelve-month chart, surpassing previous oversold episodes in October 2025 and the mild dip in early 2026. Critically, the RSI line and its signal line are essentially converging but have not yet produced a bullish crossover — meaning the technical trigger for even a short-term bounce has not fired. Prior instances of RSI reaching oversold zones on this chart did generate temporary relief rallies, but those occurred within a healthier trend structure. The current reading is occurring within an accelerating downtrend — a critical distinction that diminishes the reliability of a sustained mean-reversion bounce and increases the probability that any RSI recovery will be shallow and quickly faded.
Volume Analysis: Elevated Distribution With No Accumulation Signal
Volume at 972.86K is among the highest single-session prints in the past twelve months, and the broader volume pattern over the past six to eight weeks shows a consistent cluster of above-average volume days coinciding with down sessions — a textbook distribution pattern. There are no visible high-volume accumulation days, no bullish engulfing candles on elevated volume, and no evidence of the Buy-Side absorbing selling pressure at these levels. The volume profile is consistent with institutional exits, whether driven by sector rotation, Earnings disappointment, or macro-driven portfolio Rebalancing — all of which are systematically bearish signals that make a swift and sustained Reversal unlikely.
Key Technical Levels and Scenarios
Resistance Levels
- $310–$312 — Immediate overhead resistance (broken April support)
- $321.48 — Critical resistance (EMA-21); major recovery hurdle
- $333.84 — Major resistance (EMA-50); full structural recovery target
Support Levels
- $298–$300 — Immediate psychological floor (current price area)
- $285–$288 — Next visible support zone (Oct–Nov 2025 consolidation)
- $270–$272 — Extended downside target if $285 fails
Scenarios
- Bearish Continuation (Primary Case) — Death cross intact, RSI crossover absent, and no accumulation evidence — price breaks below $300 and accelerates toward $285 and $270 as institutional distribution continues.
- Extreme Oversold Bounce (Secondary Case) — RSI at historic lows triggers a sharp technical relief rally toward $315–$321 EMA-21, which is aggressively sold, providing a potential short re-entry opportunity. Requires RSI bullish crossover as confirmation.
- Trend Stabilisation (Very Low Probability) — A high-volume bullish reversal candle followed by a sustained close above EMA-21 at $321 on a positive fundamental catalyst could signal early bottoming — this scenario has no supporting evidence in the current data.
Conclusion: Capitulation-Level Selling with No Bottom Confirmation
L3Harris Technologies is experiencing one of the sharpest and most sustained technical breakdowns of the past year, with the decline to $302.32 printing historic oversold RSI readings while elevated volume confirms active institutional selling. The confirmed death cross, accelerating price deterioration, complete absence of accumulation signals, and breach of all meaningful support levels paint a picture where bears are firmly in control. While the extreme RSI reading will inevitably trigger a technical bounce, there is no structural evidence that such a bounce will be anything other than a short-lived relief rally to be faded. The burden of proof rests entirely with the bulls, and until EMA-21 at $321.48 is reclaimed on strong, sustained volume, every rally should be approached as a potential shorting opportunity.


 Please wait processing your request...