
Lemonade, Inc. (NYSE: LMND) closed 2025 with record operating momentum, but the equity is now at a technically decisive juncture. The Q4 shareholder letter outlines accelerating premium growth, expanding gross margins, and a narrowing EBITDA loss profile. Meanwhile, the daily chart suggests the market is reassessing near-term expectations following a sharp multi-month advance.
Below, we integrate both the fundamental trajectory and the current technical structure.
Fundamental Momentum: The AI Flywheel Scaling
Lemonade exited 2025 with In Force Premium (IFP) of $1.24 billion, up 31% year over year, marking nine consecutive quarters of accelerating IFP growth. Revenue increased 53% in Q4, while gross profit expanded 73%, with gross margin improving to 48%.
The underwriting story is equally important. The gross loss ratio declined to 52% in Q4 from 63% a year earlier. Adjusted EBITDA loss narrowed materially, and management reaffirmed a path toward Q4 2026 EBITDA breakeven and full-year profitability in 2027.
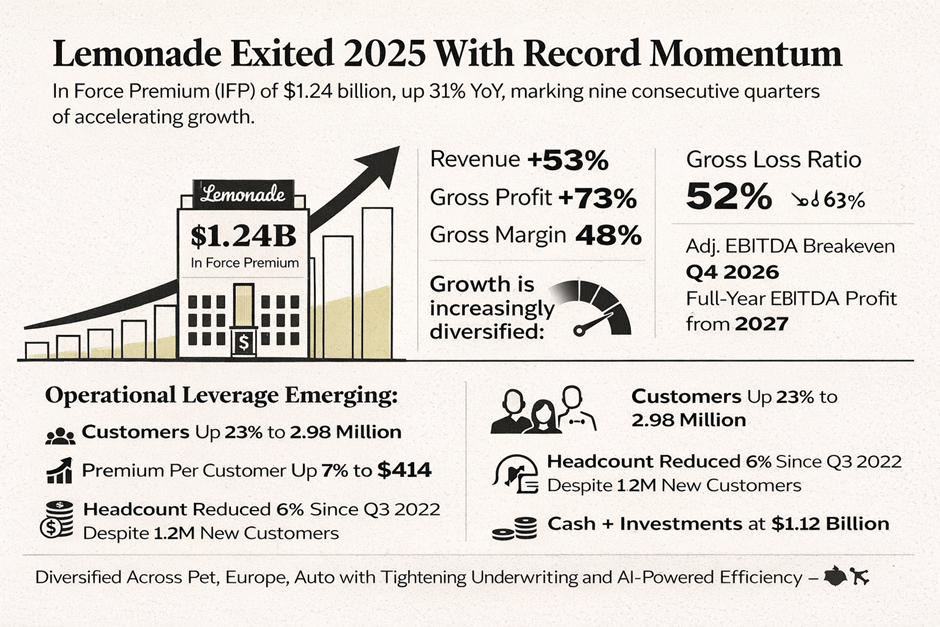
Image Source: Kalkine Group
Operational leverage continues to emerge:
- Customers up 23% to 2.98 million
- Premium per customer up 7% to $414
- Headcount reduced 6% since Q3 2022 despite adding 1.2 million customers
- Cash and investments at $1.12 billion
Growth is increasingly diversified. Pet insurance remains the largest line by IFP, Europe is scaling rapidly with improving loss ratios, and auto underwriting has materially tightened. Management’s focus remains on AI-driven pricing iteration, cross-selling, and marketing efficiency — effectively deepening the data moat.
The fundamental direction is clear: growth remains robust, underwriting is improving, and operating leverage is emerging.
The market, however, is discounting the path — not the destination.
Technical Structure: From Momentum Leader to Tactical Reset
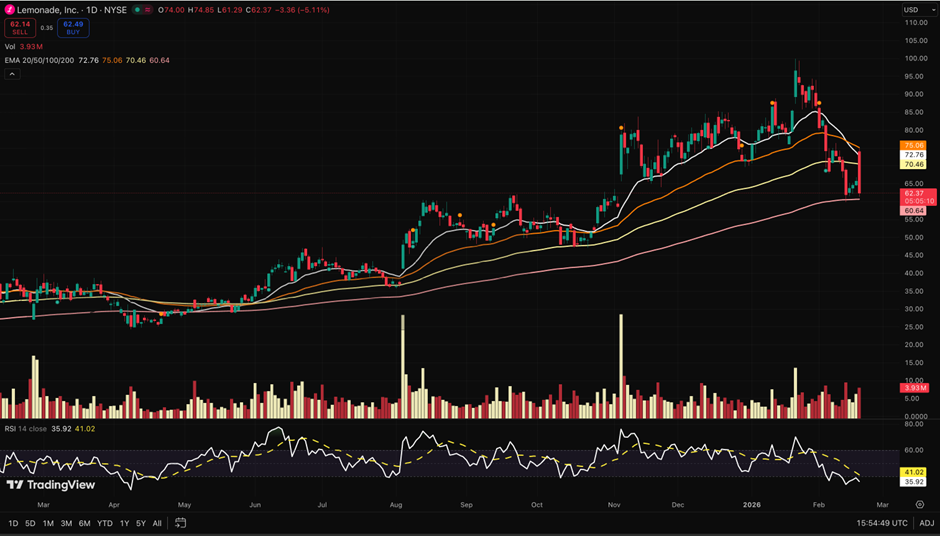
LMND Daily Price Chart. Source: tradingview.com, Analysis by Kalkine Group
On the daily timeframe, LMND rallied from the low-$30s base in mid-2025 to a peak near $100 earlier this year — a near threefold advance. That move was characterized by persistent higher highs, higher lows, and sustained positioning above all major moving averages.
That regime has now shifted.
Moving Average Structure
The stock is currently trading around $62, decisively below the 20-day (~$72), 50-day (~$75), and 100-day (~$70) exponential moving averages. More critically, price is testing the 200-day moving average near $60 — a level that has not been structurally violated since the breakout phase began.
The compression beneath the 20/50-day averages suggests short-term distribution rather than simple consolidation. The slope of the shorter-term averages has begun to flatten and roll over, indicating waning upside momentum.
RSI and Momentum
The 14-day RSI is hovering near 36–41, approaching oversold territory but not yet exhibiting bullish divergence. Momentum has clearly deteriorated from the prior uptrend regime. Importantly, we do not yet see a momentum reversal signal — merely a momentum reset.
Volume Profile
Recent downside moves have occurred on expanding volume relative to the prior consolidation phase. This suggests active repositioning rather than passive drift. However, there is not yet evidence of climactic capitulation — implying the correction may still require time or further price discovery.
Key Levels
- Immediate support: $60 (200-day EMA zone)
- Secondary support: $55–$50 (prior breakout consolidation)
- Near-term resistance: $70–$75 (cluster of 20/50/100-day EMAs)
- Major resistance: $85–$90 (prior distribution shelf)
The $60 area is technically pivotal. A decisive break and acceptance below the 200-day would likely trigger systematic de-risking and momentum-based selling. Conversely, stabilization and reclaiming the 50-day EMA would re-open the path toward trend continuation.
Synthesis: Fundamentals Strong, Technicals Transitional
The company’s operating trajectory is improving in a measurable, data-driven manner. Loss ratios are compressing, gross margins are expanding, and scale is compounding. From a fundamental standpoint, execution risk has declined materially relative to prior years.
Technically, however, the equity has shifted from expansion to digestion. The prior vertical advance priced in significant forward optimism. The current retracement reflects a recalibration of growth multiples rather than a deterioration in underlying business performance.
In institutional terms, this is no longer a momentum breakout candidate — it is transitioning into a potential medium-term accumulation phase, contingent on holding the 200-day structure.
If the broader market stabilizes and Lemonade continues to execute against its 2026 guidance, the technical reset could form a higher base. Failure to hold structural support, however, would likely extend the corrective phase toward prior consolidation bands.
For now, LMND sits at an inflection point: operationally strengthening, technically consolidating. The next move will be dictated not by narrative, but by whether price can defend long-term structure while fundamentals continue to compound.


 Please wait processing your request...