
Key Highlights
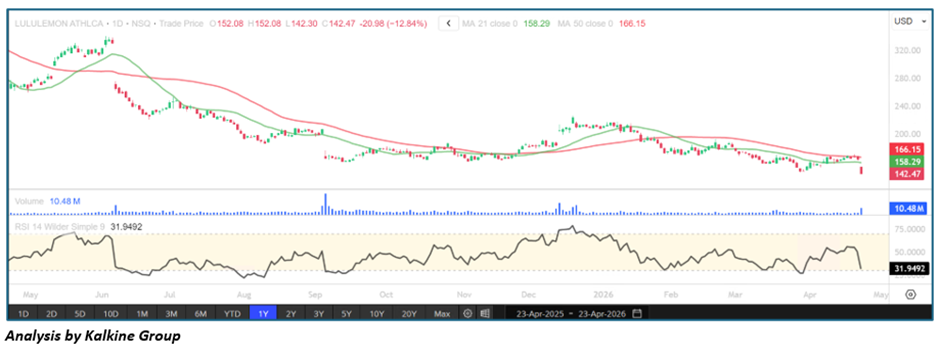
• Lululemon Athletica is trading below its 21-day (~$158.29) and 50-day (~$166.15) moving averages, indicating a bearish trend structure
• Price continues to form lower highs and lower lows, confirming sustained downtrend
• Recent rejection near moving averages suggests strong overhead resistance
• RSI near ~31 reflects weak momentum and near-oversold conditions
• Volume shows occasional spikes on declines, indicating selling pressure
Trend Structure: Established Downtrend Remains Intact
Lululemon Athletica is firmly in a downtrend, with no clear signs of reversal yet.
Key observations include:
• Consistent formation of lower highs and lower lows
• Price unable to reclaim key resistance zones
• Downward-sloping trend structure over recent months
This suggests:
• Sellers are in control
• Trend momentum is negative
• Any rallies are likely corrective in nature
The overall structure reflects continuation rather than exhaustion.
Price Action: Weak Recovery Attempts with Sharp Rejections
Recent price behavior highlights persistent selling pressure:
- Attempts to rebound have failed near ~$158–166 zone
• Price is drifting lower after each rejection
• Latest move shows sharp downside continuation
This implies:
• Strong supply overhead
• Buyers lack conviction
• Downside pressure remains dominant
Such price action typically signals:
• Continuation of bearish trend
• Risk of further breakdown
Moving Averages: Bearish Alignment Reinforces Trend
The moving average structure confirms weakness:
- Price is below the 21-day MA (~$158.29)
• Price is below the 50-day MA (~$166.15)
• Both averages are sloping downward
Interpretation:
• Short-term trend is bearish
• Medium-term trend is bearish
• Moving averages are acting as resistance
Unless price reclaims these levels:
• Downtrend is likely to persist
Momentum Indicators: RSI Near Oversold Zone
RSI is currently near ~31, indicating weak momentum.
Key signals:
• RSI is close to oversold territory (below 30)
• No clear bullish divergence visible
• Momentum continues to trend downward
Interpretation:
• Selling pressure is strong
• Short-term bounce possible due to oversold conditions
• Overall momentum remains bearish
Volume Analysis: Selling Pressure Dominates
Volume trends indicate bearish participation:
- Spikes in volume during declines
• Limited volume support during rebounds
• No clear accumulation phase
This indicates:
• Institutional selling may be present
• Weak demand at current levels
• Lack of bullish conviction
Market Structure: Bearish Continuation with Breakdown Risk
The broader structure supports further downside risk:
- Established downtrend remains intact
• Price trading below key moving averages
• Momentum and volume favor sellers
This combination typically signals:
• Continuation of bearish trend
• Potential for further downside
• Weak recovery attempts likely to fail
Key Technical Levels & Scenarios
Support Levels
- ~$140 (immediate support zone)
• ~$130 (next demand zone)
• ~$120 (major support)
Resistance Levels
- ~$158 (21-day MA resistance)
• ~$166 (50-day MA resistance)
• ~$180+ (trend reversal zone)
Scenarios
- Bearish Continuation (Primary Case)
• Price remains below $158–166 resistance
• RSI stays below 45
• Continued selling pressure
• Move toward $140–130 levels - Oversold Bounce (Secondary Case)
• RSI rebounds from near 30
• Price tests $155–160 zone
• Weak rally without breakout
• Selling resumes afterward - Bullish Reversal (Low Probability Scenario)
• Price reclaims $166 resistance
• Strong volume support
• RSI moves above 55
• Trend reversal toward $180+
Conclusion: Sustained Weakness with Limited Recovery Potential
Lululemon Athletica is exhibiting a strong bearish trend, with price trading below key moving averages and momentum indicators reflecting persistent weakness. The inability to reclaim resistance levels and the continuation of lower highs suggest that sellers remain firmly in control.
While short-term oversold conditions may trigger brief rebounds, the overall structure favors further downside unless a decisive breakout above key resistance occurs.


 Please wait processing your request...