
Key Highlights
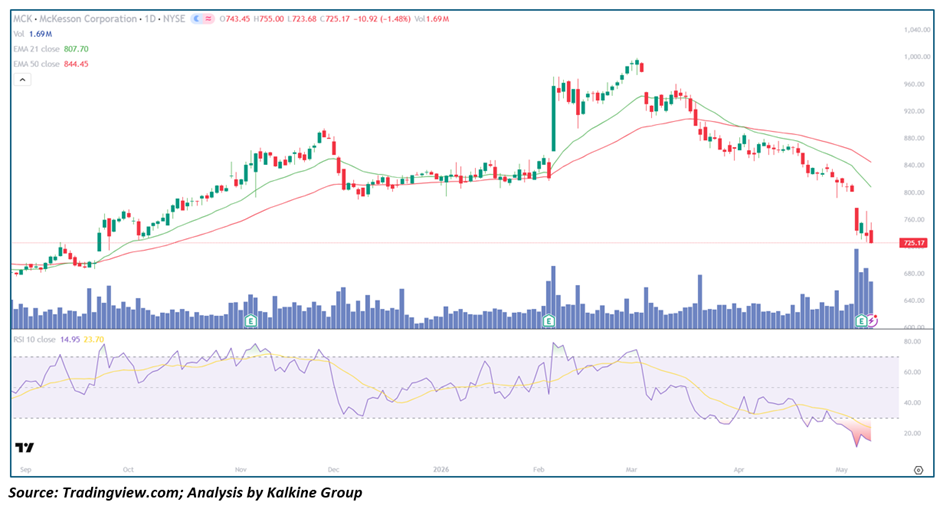
- McKesson (NYSE: MCK) is collapsing to $725.17 (-1.48%), now down a devastating ~$275 from its $1,000+ peak in February 2026 — a staggering 27%+ destruction of Market Value in under three months
- Price is trading a massive $82 below EMA-21 ($807.70) and $119 below EMA-50 ($844.45), with both MAs rolling over sharply in a fully confirmed Death Cross alignment
- RSI-10 at an extreme 14.95 with smoothing average at 23.70 — the most catastrophically oversold reading visible anywhere on the entire twelve-month chart, with the RSI plunging into territory not seen in the stock's recent history
- Volume at 1.69M represents one of the highest single-session readings in the past year, with the recent cluster of massive volume spikes on down days confirming aggressive institutional distribution at a systemic scale
- Structure has suffered a complete and total breakdown, with price crashing through every meaningful support level and now threatening the critical $720–$725 zone — the last identifiable floor on the chart
Trend Structure: Catastrophic Structural Collapse — Bull Phase Entirely Reversed
MCK's technical story over the past twelve months has been one of dramatic Reversal — from a powerful multi-month uptrend that carried price from $640 in September 2025 all the way to an extraordinary $1,000+ peak in February 2026, to a freefall collapse that has now surrendered the entire advance and then some. The stock spent the October–December 2025 period consolidating between $800 and $880, building what appeared to be a healthy base before the February breakout. However, the violent rejection from the $1,000 level and the subsequent breach of both EMAs in March 2026 signaled a fundamental shift in market sentiment. Since then, the decline has been relentless and accelerating — lower highs, lower lows, and no stabilization whatsoever. Price is now approaching levels last seen in September–October 2025, effectively wiping out seven months of gains in a matter of weeks.
Price Action: Vertical Waterfall With $720 as the Last Known Support
The price action in MCK over the past six to eight weeks is nothing short of a Capitulation event — large, dominant red candles with minimal wick recoveries, shallow bounces that Fail within one to two sessions, and a pace of decline that has visibly accelerated rather than moderated as price approaches technically significant levels. The $760–$780 zone, which represented a consolidation area in October–November 2025, offered virtually no meaningful support and was sliced through in a single session. With today's close at $725.17 and an intraday low of $723.68, the stock is now testing the September 2025 baseline support in the $720–$730 range — the absolute last identifiable floor before a technical vacuum opens toward the $660–$680 area. Any daily close below $720 on elevated volume would represent a severe technical breakdown with no visible support beneath.
Moving Averages: Death Cross at Maximum Divergence — EMAs Offer No Near-Term Hope
The EMA configuration for MCK is about as bearish as technically possible. With price at $725.17 sitting $82.53 below EMA-21 ($807.70) and $119.28 below EMA-50 ($844.45), the magnitude of the divergence between price and both moving averages is extraordinary — and critically, the gap is still widening, confirming that the rate of decline continues to outpace the falling averages. The death cross has been firmly in place since late March, and both EMAs are now pointing sharply lower with no sign of flattening. Reclaiming EMA-21 alone would require a +11.4% rally from current levels — a move of immense magnitude that would Demand extraordinary institutional buying and a powerful fundamental catalyst, neither of which is remotely visible in the current technical structure.
Momentum Indicators: Most Extreme Oversold Reading in Chart History — Divergence Without Crossover
RSI-10 at 14.95 is not simply oversold — it is at a level of technical exhaustion rarely seen in large-cap equities, representing the single most extreme momentum reading across the entire twelve-month chart by a significant Margin. The smoothing average at 23.70 remains far above the RSI line, indicating that the momentum signal has not produced a bullish crossover and the short-term technical bounce trigger remains unfired. While prior oversold episodes on this chart — visible in December 2025 and early 2026 — generated temporary relief rallies, those occurred in a structurally healthier environment where the broader trend was still supportive. The current reading is unfolding within a fully broken, aggressively declining trend, which historically reduces the reliability of mean-reversion bounces and increases the risk that any RSI recovery is shallow, brief, and quickly reversed.
Volume Analysis: Institutional Exodus at Maximum Intensity
The volume profile for MCK over the past three to four weeks is among the most bearish patterns visible anywhere on this chart. The two largest volume spikes in the entire twelve-month period have both occurred within the past two weeks, both on significant down days — a definitive signature of forced institutional selling at scale. Today's 1.69M session is massive relative to the Average Daily Volume visible throughout 2025 and early 2026. There are no high-volume accumulation candles, no signs of Buy-Side absorption, and no volume divergence patterns that would suggest smart money is stepping in at these levels. The pattern is consistent with either forced Liquidation from leveraged positions, large-scale fundamental-driven institutional exits, or both — and systematically bearish signals of this nature do not resolve quickly or cleanly.
Key Technical Levels and Scenarios
Resistance Levels
- $750–$755 — Immediate overhead resistance (today's open / intraday high)
- $807.70 — Critical resistance (EMA-21); major structural recovery hurdle
- $844.45 — Major resistance (EMA-50); full trend recovery target
Support Levels
- $720–$725 — Immediate and critical psychological floor (current price area)
- $680–$690 — Next visible support zone (pre-rally base, Sept 2025)
- $655–$660 — Extended downside target if $680 fails
Scenarios
- Bearish Continuation (Primary Case) — No accumulation signal, death cross entrenched, RSI crossover absent — price breaks below $720 and accelerates toward $680 and $655 as institutional distribution continues at scale.
- Extreme Oversold Bounce (Secondary Case) — RSI at historic extremes triggers a violent but shallow technical snap-back toward $760–$808 EMA-21, which is aggressively sold into — offering a potential short re-entry. Requires RSI bullish crossover as minimum confirmation.
- Trend Stabilisation (Very Low Probability) — A massive high-volume bullish reversal candle followed by a sustained close above EMA-21 at $807 driven by a powerful fundamental catalyst could signal early bottoming — this scenario has zero supporting evidence in the current technical data.
Conclusion: Unprecedented Selling Intensity with Zero Bottom Confirmation
McKesson Corporation is undergoing one of the most severe technical collapses in its recent history, with today's decline to $725.17 registering an RSI reading of 14.95 — the most extreme oversold condition on the entire chart — while volume surges of historic magnitude confirm that institutional players are exiting at an aggressive and systemic pace. The confirmed death cross, $119 price-to-EMA-50 divergence, accelerating waterfall price action, total absence of accumulation, and breach of every meaningful support level collectively present a picture of complete bear dominance. While the catastrophic RSI reading will mechanically produce a technical bounce at some point, the structural and volume evidence provides zero support for the view that such a bounce will be anything more than a brief relief rally to be aggressively faded. The burden of proof remains entirely with the bulls, and until EMA-21 at $807.70 is reclaimed on strong, sustained volume, every rally in MCK should be treated as a shorting opportunity.


 Please wait processing your request...