
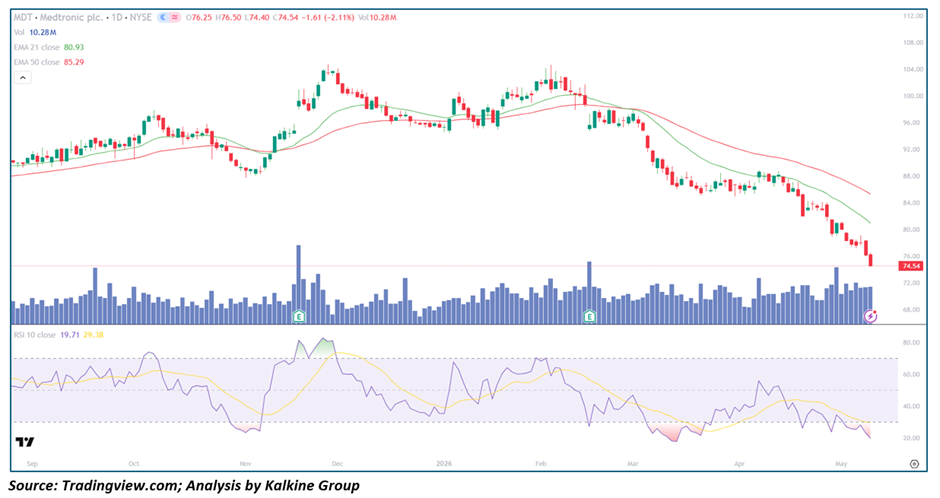
Key Highlights
- Medtronic (NYSE: MDT) is declining to $74.54 (-2.11%), now down a severe ~$29 from its $103+ peak in February 2026 — representing a 28%+ erosion of Market Value in under three months
- Price is trading $6.39 below EMA-21 ($80.93) and $10.75 below EMA-50 ($85.29), with both MAs sloping aggressively downward in a fully confirmed Death Cross alignment
- RSI-10 at a critical 19.71 with smoothing average at 29.38 — plunging into the most extreme oversold zone visible on the chart, with the RSI-signal divergence of nearly 10 points indicating momentum is still accelerating to the downside
- Volume at 10.28M is among the highest readings in the twelve-month period, with the recent surge in down-day volume confirming active and systematic institutional distribution
- Price has now broken below the critical $75–$76 support band — the last visible floor on the chart — opening a technical vacuum toward the $68–$70 area
Trend Structure: Prolonged Bear Phase With Accelerating Terminal Decline
MDT's technical history over the past twelve months tells a story of gradual deterioration giving way to a sudden, violent collapse. The stock spent much of September through February oscillating in a broad $88–$104 range, with periodic rallies failing at progressively lower highs — a hallmark of stealth distribution. The decisive break below the $96 support level in late February 2026 and the simultaneous EMA death cross confirmed a fundamental shift from range-bound weakness to a full bear phase. Since then, the decline has been systematic and unrelenting — each attempted stabilization in the $84–$88 zone in March and April was met with fresh waves of selling, and the most recent leg lower from $84 to $74 in May represents a sharp acceleration of what was already a deteriorating structure. There is no base formation, no accumulation pattern, and no technical evidence that the selling pressure is anywhere near exhaustion.
Price Action: Accelerating Freefall With Critical $75 Support Now Breached
The most alarming development in MDT's current price action is the breach of the $75–$76 horizontal support zone, which represented a significant consolidation area visible on the left side of the chart in the September–October 2025 period. Today's close at $74.54 with an intraday low of $74.40 confirms this level has now been violated on a closing basis — a bearish development of significant technical weight. The candles over the past three weeks are dominated by large-bodied red sessions with minimal lower wick recovery, indicating sellers are in full control with buyers offering virtually no meaningful resistance. The pace of decline — from $84 to $74 in approximately fifteen trading sessions — represents an annualized rate of deterioration that is unsustainable but also, critically, shows no technical sign of slowing based on the current candle structure.
Moving Averages: Death Cross Fully Entrenched — Gap Between Price and EMAs at Maximum Stretch
The EMA picture for MDT leaves no room for a bullish interpretation. Price at $74.54 sits $6.39 below EMA-21 ($80.93) and $10.75 below EMA-50 ($85.29) — and crucially, both EMAs are themselves pointing sharply lower with no sign of flattening or convergence. The death cross has been confirmed for several weeks and both moving averages are now acting as multi-layered resistance overhead. Reclaiming EMA-21 at $80.93 alone would require an +8.6% rally from current levels — a substantial move demanding extraordinary buying conviction and a powerful fundamental catalyst. Reclaiming EMA-50 at $85.29 would require a +14.4% recovery — a feat that appears structurally impossible without a major fundamental re-rating event that has no visible precedent in the current data.
Momentum Indicators: Historic Oversold Extremes — RSI-Signal Divergence Signals Ongoing Acceleration
RSI-10 at 19.71 with its smoothing line at 29.38 presents one of the most technically alarming momentum configurations visible on this chart. The near 10-point gap between the RSI and its signal line — with RSI below signal — indicates that momentum is not merely oversold but is actively accelerating to the downside, and the bounce trigger (RSI crossing back above its smoothing line) has not remotely fired. Comparing this reading to the prior oversold episode visible in late November 2025, when RSI briefly dipped below 30 and generated a sharp recovery, reveals a critical difference: that prior episode occurred while the stock was still in a broadly range-bound structure with EMA support intact. The current reading is unfolding within a confirmed and accelerating downtrend — a context in which oversold RSI readings can persist far longer and resolve far less cleanly than in healthier market structures.
Volume Analysis: Surge in Distribution Volume Confirms Institutional Exit
Volume at 10.28M is exceptionally elevated relative to the typical daily volume visible throughout much of 2025 and early 2026, and the broader pattern over the past four to six weeks shows a clear and concerning trend — the largest volume sessions are concentrated on down days, with no equivalent surge in buying volume on any of the attempted bounces. The two most significant volume spikes in the twelve-month period both coincide with sharp down moves, consistent with forced institutional Liquidation rather than emotional retail selling. The complete absence of high-volume accumulation candles — no hammer reversals, no bullish engulfing patterns on elevated volume — confirms that the Buy-Side is not absorbing Supply at current levels, and the selling is systematic in nature.
Key Technical Levels and Scenarios
Resistance Levels
- $76.00–$76.50 — Immediate overhead resistance (today's open / intraday high area)
- $80.93 — Critical resistance (EMA-21); primary recovery hurdle
- $85.29 — Major resistance (EMA-50); full structural recovery target
Support Levels
- $73.00–$74.00 — Immediate floor (current price area)
- $70.00–$71.00 — Next visible support zone (pre-2025 base levels)
- $67.00–$68.00 — Extended downside target if $70 fails
Scenarios
- Bearish Continuation (Primary Case) — Death cross confirmed, RSI-signal gap widening, no accumulation present — price breaks below $73 and accelerates toward $70 and $67 as institutional distribution continues unabated.
- Extreme Oversold Bounce (Secondary Case) — RSI at historic extremes mechanically triggers a sharp technical snap-back toward $79–$81 EMA-21, which is aggressively sold into — offering a potential short re-entry. Requires RSI bullish crossover above signal line as minimum confirmation.
- Trend Stabilisation (Very Low Probability) — A high-volume bullish Reversal candle followed by a sustained daily close above EMA-21 at $80.93 on a compelling fundamental catalyst could signal early bottoming — this scenario has zero supporting evidence in the current price, volume, or momentum data.
Conclusion: Bears Fully in Control With No Capitulation Floor Yet Established
Medtronic is experiencing a sustained and now accelerating technical breakdown that has carried price from $103 to $74 in under three months, with today's breach of the critical $75–$76 support zone removing the last identifiable technical floor on the chart. RSI-10 at 19.71 represents the most extreme oversold reading in the twelve-month period, yet the near 10-point gap between RSI and its signal line confirms that momentum is still accelerating rather than stabilising. Elevated volume on down sessions confirms systematic institutional distribution with zero evidence of buy-side absorption. The death cross EMA structure, complete absence of accumulation signals, and breach of all meaningful support collectively confirm that bears are firmly and completely in control of MDT. Until EMA-21 at $80.93 is reclaimed on strong and sustained volume, every rally in Medtronic must be treated as a distribution opportunity and approached with extreme caution by would-be buyers.


 Please wait processing your request...