
Key Highlights
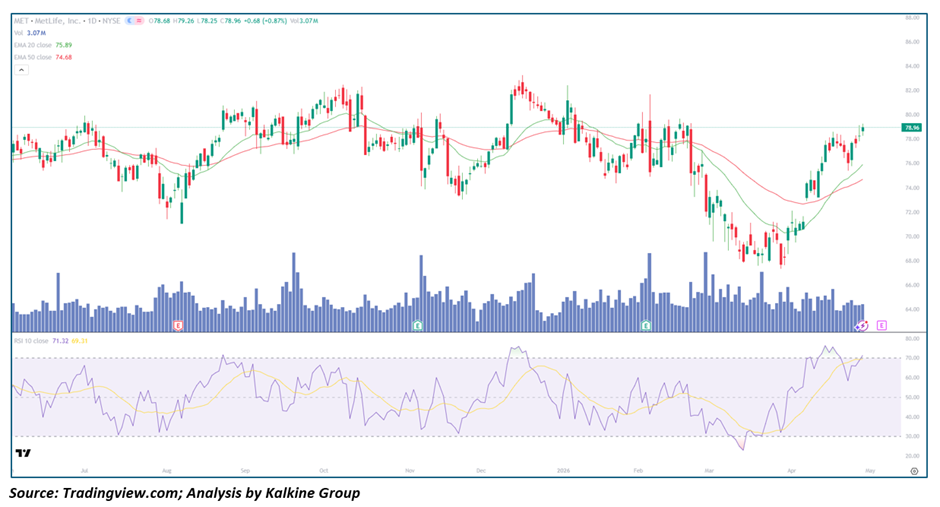
• MetLife is trading above its 20-day (~$75.89) and 50-day (~$74.68) moving averages, signaling improving trend strength
• Price has rebounded sharply from the $68–$70 zone and is now approaching the $79–$80 resistance area
• RSI near ~71 indicates strong momentum with early overbought conditions
• Volume has supported the recent recovery, suggesting renewed buying interest
• Price structure is shifting from lower lows to higher lows, indicating a potential trend Reversal
Trend Structure: Transition from Weakness to Recovery Phase
MetLife is currently undergoing a structural shift from a previously weak and range-bound trend into a recovery phase. Earlier price action showed signs of distribution, with inconsistent momentum and periodic breakdowns. However, the recent rally from the $68–$70 support zone has altered the technical landscape significantly.
The formation of higher lows during the recent upswing suggests that buyers are regaining control. This is a critical early signal of a potential trend Reversal. While the broader structure is not yet a fully established uptrend, the transition phase is clearly underway. Sustained strength above current levels could confirm a shift into a bullish trend.
Price Action: Strong Bounce with Resistance Test Ahead
The recent price action is marked by a sharp and decisive rebound, followed by steady continuation toward the $79–$80 resistance zone. The rally appears impulsive rather than corrective, indicating strong buying conviction.
However, the stock is now approaching a key resistance area where previous selling pressure has emerged. This zone will be crucial in determining the next directional move. A breakout above $80 would signal continuation of the recovery, while rejection could lead to short-term consolidation or a pullback.
Importantly, the absence of significant bearish candles during the rise suggests that sellers are not aggressively countering the move, which supports the bullish case.
Moving Averages: Bullish Reclaim Signals Strength
One of the most notable developments is the price reclaiming both the 20-day and 50-day moving averages. This shift is often seen as an early confirmation of trend improvement.
- The 20-day EMA (~$75.89) now acts as immediate support
• The 50-day EMA (~$74.68) provides a stronger base for the recovery
Both moving averages are beginning to flatten and turn upward, which indicates a transition from bearish to neutral-to-bullish conditions. If the price continues to hold above these levels, they will reinforce the developing uptrend.
Momentum Indicators: RSI Reflects Strong Buying Pressure
The Relative Strength index (RSI) is currently around 71, placing it in overbought territory. While this may suggest the potential for short-term cooling, it also reflects strong buying momentum.
Key observations:
• RSI has moved sharply upward from lower levels
• Momentum is currently bullish
• No clear bearish divergence is present
In recovery phases, RSI often reaches overbought levels as part of a strong Reversal move. Therefore, this should not be immediately interpreted as a Reversal signal but rather as a sign of strength, with the possibility of consolidation.
Volume Analysis: Rising Participation Supports Recovery
Volume trends during the recent rally show increased participation, particularly during upward moves. This indicates that the recovery is supported by genuine buying interest rather than low-Volume price drift.
There is no significant spike in selling Volume near resistance, which suggests that distribution is not yet a dominant Factor. Continued Volume support on further upside would strengthen the case for a sustained trend Reversal.
Market Structure: Early Bullish Shift with Confirmation Needed
The overall market structure is transitioning from bearish to potentially bullish. While the recent price action is encouraging, confirmation is still required for a full trend Reversal.
Key structural elements:
• Break from prior downtrend pattern
• Formation of higher lows
• Reclaim of key moving averages
This places the stock in a critical phase where follow-through will determine whether the recovery evolves into a sustained uptrend or fades into consolidation.
Key Technical Levels and Scenarios
Support Levels
• $75–$76 near the 20-day EMA
• $74–$75 near the 50-day EMA
• $70–$72 as major support zone
Resistance Levels
• $79–$80 as immediate resistance
• $82–$84 as next upside target zone
Scenarios
- Breakout and Trend Continuation (Primary Case)
• Price breaks above $80 with Volume
• RSI remains strong
• Move toward $82–$85 range - Consolidation Near Resistance (Secondary Case)
• Price stalls below $80
• Sideways movement forms a base
• Momentum resets before next move - Pullback Within Recovery (Healthy Correction)
• Price retraces toward $75–$76
• Support holds at moving averages
• Uptrend attempt resumes
Conclusion: Recovery Strength Emerging with Breakout Watch
MetLife is showing clear signs of recovery, supported by strong price action, improving momentum, and reclaim of key moving averages. While the stock is approaching an important resistance zone, the overall structure suggests that buyers are gaining control.
A confirmed breakout above $80 would significantly strengthen the bullish outlook and mark the transition into a sustained uptrend. Until then, the stock remains in a recovery phase, with short-term consolidation or pullbacks likely to serve as part of a broader base-building process.


 Please wait processing your request...