
Microsoft Stock Analysis 2025–2026: Revenue Growth and Earnings Performance
Microsoft Corporation enters the 2025–2026 fiscal period with sustained double-digit growth across revenue and earnings, supported primarily by cloud computing and artificial intelligence adoption. Quarterly revenue reached $81.3 billion, increasing 17% in constant currency. Operating income rose 21%, while earnings per share climbed 24% in constant currency when adjusted for the accounting impact of its OpenAI investment.
This performance reflects both topline expansion and operating leverage. Operating margin reached 47%, underscoring efficiency in scaling high-margin commercial software and cloud services. Gross margin, at 68%, declined modestly year over year, largely due to continued AI infrastructure spending and higher usage of AI-powered services. Even so, the company-maintained profitability while investing heavily in future capacity.
Cash flow from operations rose 60% to $35.8 billion, driven by strong cloud billings and collections. Free cash flow stood at $5.9 billion, down sequentially as capital expenditure accelerated. Microsoft returned $12.7 billion to shareholders through dividends and share repurchases, reflecting a balanced capital allocation approach.
Microsoft Cloud and Azure Revenue Growth: Crossing the $50 Billion Milestone
A defining feature of Microsoft’s 2025 performance is the scale of its cloud operations. Microsoft Cloud revenue reached $51.5 billion in the quarter, marking the first time the segment surpassed $50 billion. Growth of 26% in constant currency was driven by enterprise demand for infrastructure, data, and AI workloads.
Within Intelligent Cloud, revenue totaled $32.9 billion, up 29% in constant currency. Azure and other cloud services grew 39%, supported by strong demand across industries and regions. Management indicated that demand continues to exceed available supply, highlighting ongoing capacity constraints despite aggressive infrastructure expansion.
Commercial bookings increased 23% in constant currency, supported by large multi-year Azure commitments, including those linked to OpenAI and Anthropic partnerships. Commercial remaining performance obligation (RPO) rose to $625 billion, providing visibility into contracted future revenue streams. Approximately 45% of RPO is associated with OpenAI contracts, while the remaining balance grew 28%, indicating broad-based customer diversification.
AI Strategy and Copilot Adoption: Microsoft’s Enterprise AI Expansion
Artificial intelligence has become central to Microsoft’s growth narrative. Microsoft 365 Copilot paid seats reached 15 million, with seat growth exceeding 160% year over year. The number of customers deploying more than 35,000 seats tripled, signaling deep enterprise adoption. Commercial Microsoft 365 cloud revenue increased 17% in constant currency, supported by E5 upgrades and Copilot monetization.
GitHub Copilot also expanded rapidly, with 4.7 million paid subscribers, up 75% year over year. Individual Copilot Pro Plus subscriptions grew 77% sequentially, demonstrating traction among developers. These products extend Microsoft’s reach beyond infrastructure into workflow productivity and coding automation.
Fabric, Microsoft’s unified analytics platform, surpassed a $2 billion annualized revenue run rate, supported by over 31,000 customers and 60% year-over-year growth. Management has framed this as part of a broader “agent platform” strategy, integrating data, models, and enterprise context into AI-driven applications.
At the infrastructure layer, Microsoft introduced the Maya 200 custom accelerator, delivering over 30% improvement in total cost of ownership compared with prior fleet hardware. Executives emphasized “tokens per watt per dollar” as a new optimization metric, reflecting the economic discipline underpinning AI compute investments.
Capital Expenditures and AI Infrastructure Investment Outlook
Capital expenditures totaled $37.5 billion for the quarter, with approximately two-thirds directed toward short-lived assets such as GPUs and CPUs. Finance leases accounted for $6.7 billion, largely for large data center facilities. This elevated spending reflects efforts to close the gap between customer demand and supply, while also supporting first-party AI services such as Copilot.
Management acknowledged that operating margins in the near term may face modest pressure due to AI investment intensity. Gross margin percentage declined slightly, and next-quarter operating margins are expected to be down marginally year over year. However, for fiscal 2026, operating margins are projected to rise slightly, aided by revenue mix shifts and investment prioritization earlier in the year.
A significant portion of capital expenditure is already contracted under long-duration Azure agreements, mitigating the risk of underutilized hardware. Nevertheless, rising memory prices could introduce volatility in both capital expenditures and transactional server demand.
Segment Performance: Strength in Commercial, Weakness in Gaming
Productivity and Business Processes revenue reached $34.1 billion, growing 16% in constant currency. Dynamics 365 revenue increased 19%, while LinkedIn revenue rose 11%, led by marketing solutions.
In contrast, More Personal Computing revenue declined 3% to $14.3 billion. Gaming revenue fell 9% in constant currency, with Xbox content and services revenue down 5%, reflecting weaker-than-expected first-party content performance. Windows OEM revenue benefited from Windows 10 end-of-support dynamics but is expected to normalize.
The divergence between enterprise cloud strength and consumer-exposed weakness illustrates Microsoft’s evolving revenue mix, increasingly weighted toward commercial and AI-driven businesses.
Microsoft Fiscal 2026 Outlook and Key Risks
For the upcoming quarter, revenue guidance ranges between $80.65 billion and $81.75 billion, with foreign exchange expected to contribute approximately three percentage points to growth. Azure growth is projected between 37% and 38% in constant currency.
Key risks include sustained pressure on gross margins from AI infrastructure spending, volatility in gaming, potential impacts from rising memory prices, and supply-demand imbalances in data center capacity. Additionally, quarterly variability in bookings and RPO may arise from the timing of large multi-year contracts.
Strategic Positioning in AI and Cloud Infrastructure
Microsoft’s 2025–2026 trajectory reflects a deliberate expansion across every layer of the AI stack: infrastructure, platform services, and high-value applications. Azure growth, Copilot adoption, and large contracted backlogs reinforce the scale of enterprise demand. At the same time, elevated capital intensity and selective consumer weakness temper the margin profile.
Overall, Microsoft enters fiscal 2026 as a company prioritizing long-term AI capacity and enterprise integration, while maintaining strong revenue growth and operating leverage. The central question for the coming period is not growth momentum, which remains solid, but the pace at which AI investments translate into sustained margin expansion and durable cash generation.
Technical Analysis (Daily Price Chart Analysis)
Moving Averages and Primary Trend Configuration
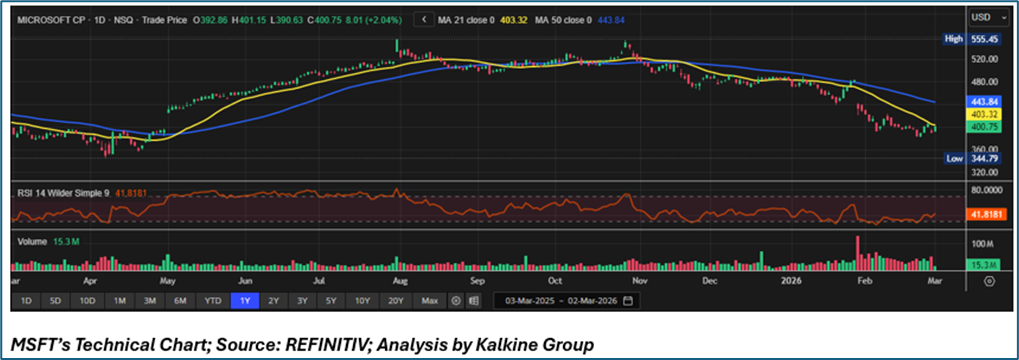
Microsoft Corporation is currently positioned within a corrective phase following a broader multi-month advance. The daily chart indicates price trading near $400.75, below both the 21-day moving average (~$403.32) and materially beneath the 50-day moving average (~$443.84). The downward slope of the 50-day average confirms deterioration in intermediate-term trend structure, while the shorter 21-day average reflects only a tentative stabilization rather than a confirmed reversal. The persistent gap between price and the 50-day average suggests that the stock remains in a technically weakened posture, with rallies thus far representing counter-trend recoveries rather than a re-establishment of primary upward momentum.
Momentum Analysis and RSI Dynamics
The 14-period RSI is registering near 41.8, reflecting subdued momentum and positioning within the lower half of the oscillator range. Although not in deeply oversold territory, the RSI’s inability to reclaim the 50 threshold underscores continued bearish bias in momentum conditions. The recent modest uptick suggests short-term relief buying; however, the absence of a bullish divergence against prior price lows limits conviction in a sustained reversal scenario. For technical sentiment to improve materially, the RSI would need to establish a higher high above 50–55, signaling constructive momentum re-accumulation.
Volume Structure and Key Support–Resistance Framework
Recent volume patterns reveal elevated participation during the prior selloff phase, particularly as price approached the $360–$380 region, indicating distribution pressure during declines. Current volumes appear comparatively moderate, suggesting that the recent rebound lacks strong institutional sponsorship. Technically, the $390–$405 band now functions as immediate resistance given its proximity to the 21-day average, while the $440–$445 zone near the 50-day average represents a more substantial overhead supply area. On the downside, the recent swing low near $344.79 defines critical structural support. Overall, MSFT’s technical configuration reflects a corrective structure within a longer-term bullish framework, with confirmation of trend stabilization contingent upon reclaiming key moving averages on expanding volume.
Final Perspective
Microsoft Corporation enters fiscal 2026 with strong cloud and AI-driven revenue momentum, underpinned by expanding Azure demand, Copilot adoption, and a substantial contracted backlog. Elevated capital expenditures and near-term margin pressure reflect deliberate investment in long-duration AI infrastructure rather than structural weakness in the core business. The medium-term trajectory will depend on the pace at which AI monetization offsets infrastructure intensity and restores sustained margin expansion.


 Please wait processing your request...