
Key Highlights
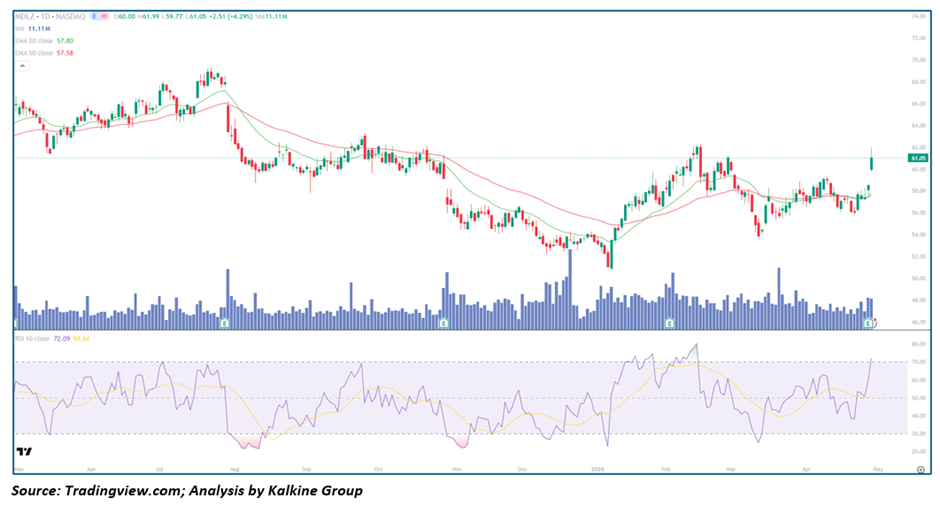
• Mondelez (Nasdaq: MDLZ) is trading above its 20-day (~57.80) and 50-day (~57.58) moving averages, indicating improving trend strength
• Price has broken above the key 60 resistance zone with a strong bullish candle
• RSI near ~72 signals overbought conditions but not extreme
• Volume has expanded during the recent breakout
• Structure shifting from downtrend to recovery phase
Trend Structure: Transition from Downtrend to Recovery
MDLZ is showing signs of reversing its prior downtrend and entering a recovery phase.
Key observations include:
• Formation of higher lows after a prolonged decline
• Breakout above recent consolidation range
• Early development of higher highs
This suggests:
• Selling pressure is fading
• Buyers are regaining control
• Trend is transitioning toward bullish
The structure reflects a base formation evolving into a potential uptrend.
Price Action: Breakout with Strong Momentum
Recent price behavior highlights improving strength:
- Strong bullish breakout above the 60 level
• Wide-range candle indicating strong Demand
• Follow-through strength after consolidation
This implies:
• Buyers are stepping in aggressively
• Resistance zones are being cleared
• Momentum is building for continuation
Such action typically signals:
• Potential for further upside
• Strength after prolonged weakness
Moving Averages: Bullish Reclaim
The Moving Average structure supports the recovery:
- Price has reclaimed both the 20-day and 50-day MAs
• Both averages are flattening and turning upward
• Short-term average is attempting to stay above medium-term
Interpretation:
• Short-term trend is bullish
• Medium-term trend is stabilizing
• Averages may act as support on dips
Momentum Indicators: Strong but Slightly Overbought
RSI is currently near the 70+ zone, reflecting strong momentum.
Key signals:
• RSI above 70 indicates overbought conditions
• Reflects strong buying pressure
• Not yet at extreme levels
Interpretation:
• Momentum is strong
• Minor pullback or consolidation possible
• Upside can continue after cooling
Volume Analysis: Breakout Supported by Participation
Volume trends confirm the move:
- Noticeable increase during breakout
• Consistent participation during recovery
• No major signs of distribution
This indicates:
• Buyers are supporting the move
• Breakout has credibility
• Institutional interest may be present
Market Structure: Bullish Shift with Moderate Extension
The broader structure supports a positive outlook:
- Breakout from consolidation confirmed
• Price above key moving averages
• Momentum slightly extended but manageable
This combination suggests:
• Continued upside bias
• Controlled risk of pullback
• Need for consolidation to sustain trend
Key Technical Levels and Scenarios
Support Levels
• 60 as immediate support
• 57–58 near moving averages
• 55 as deeper support zone
Resistance Levels
• 62 as immediate resistance
• 65 as next upside target
• 68 as extended breakout level
Scenarios
- Bullish Continuation (Primary Case)
• Price holds above 60
• Momentum remains strong
• Volume supports move
• Upside toward 62–65 - Healthy Consolidation (Secondary Case)
• RSI cools from overbought
• Price ranges between 58–61
• Buyers defend support
• Uptrend resumes - Pullback Scenario (Low Probability)
• Failure to hold 60
• Price slips below moving averages
• Retest of 55 zone
• Recovery attempt follows
Conclusion: Recovery Gaining Strength
Mondelez is showing a strong breakout backed by improving momentum and Volume after a prolonged downtrend. While RSI suggests slightly overbought conditions, the overall structure indicates a bullish shift with room for further upside. Short-term consolidation may occur, but the trend appears to be turning positive with improving strength.


 Please wait processing your request...