
Key Highlights
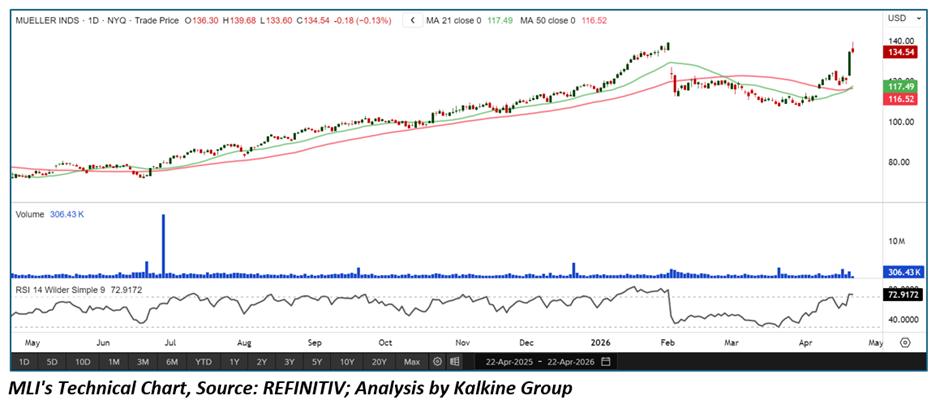
• Mueller Industries Inc. (NYSE: MLI) is trading well above its 21-day (~$117.49) and 50-day (~$116.52) SMAs, confirming a strong uptrend
• Recent breakout toward the ~$135 zone signals continuation strength
• RSI near ~73 indicates overbought conditions with strong momentum
• Price action shows higher highs and higher lows across the broader trend
• Industrial demand strength and cyclical tailwinds are supporting bullish sentiment
Trend Structure: Established Uptrend with Acceleration
MLI is firmly in a bullish trend with signs of recent acceleration.
Key observations include:
• Consistent pattern of higher highs and higher lows
• Strong upward slope in both short- and medium-term moving averages
• Recent breakout leg pushing price toward new highs
This suggests the stock is not consolidating but rather continuing a well-established uptrend with increasing momentum.
Price Action: Breakout Strength with Momentum Expansion
Recent price behavior reflects strong buying pressure:
• Sharp move higher into the ~$135–140 zone
• Break above prior consolidation range
• Wide bullish candles indicating aggressive demand
This implies:
• Buyers are in clear control
• Momentum traders are likely participating
• Breakout continuation is possible, though short-term exhaustion risk exists
Moving Averages: Strong Bullish Alignment
The moving average structure is clearly positive:
• Price significantly above the 21-day SMA (~$117.49)
• 21-day SMA above the 50-day SMA (~$116.52)
• Both averages trending upward
Interpretation:
• Short-term momentum is strong
• Medium-term trend confirms bullish structure
• Moving averages now act as dynamic support zones
Momentum Indicators: RSI Signals Strength but Overbought Risk
RSI is reflecting strong bullish momentum:
• RSI around ~73 (overbought territory)
• Persistent strength without meaningful pullbacks
• No immediate bearish divergence visible
Interpretation:
• Trend remains bullish unless RSI sharply reverses
Volume Analysis: Participation Supports the Move
Volume trends show supportive participation:
• Gradual increase during upward moves
• Occasional spikes confirming breakout attempts
• No major distribution signals
This indicates:
• Buyers are engaged
• Institutional participation likely present
• Trend sustainability remains intact
Market Structure: Cyclical Strength Supporting Trend
The broader structure reflects favorable conditions:
• Industrial and metals-related demand supporting revenues
• Exposure to construction, infrastructure, and manufacturing cycles
• Stable earnings profile enhancing investor confidence
This often leads to:
• Trend persistence
• Strong dip-buying behavior
• Outperformance during economic expansion phases
Key Technical Levels & Scenarios
Support Levels
• ~$125–127 (recent breakout zone)
• ~$117 (21-day SMA — immediate dynamic support)
• ~$116 (50-day SMA — major support)
Resistance Levels
• ~$140 (near-term psychological resistance)
• ~$145+ (potential extension zone if momentum continues)
Scenarios
- Bullish Continuation (Primary Case)
• Price holds above $125
• RSI stays above 60
• Gradual move toward $140–145 - Healthy Pullback (Secondary Case)
• Short-term dip toward $120–125
• RSI cools toward 55–60
• Uptrend remains intact - Trend Weakening (Risk Scenario)
• Break below $117 (21-day SMA)
• RSI drops below 50
• Shift toward deeper consolidation near $110
Conclusion: Strong Uptrend with Short-Term Extension Risk
Mueller Industries remains in a strong bullish trend supported by solid price structure and favorable macro conditions. However, with RSI in overbought territory and price extended above key moving averages, the stock may experience short-term consolidation or a pullback before continuing higher.
Unless price breaks below key support levels near the 21-day moving average, the overall outlook remains bullish, with dips likely to be viewed as buying opportunities rather than trend reversals.


 Please wait processing your request...