
Key Highlights
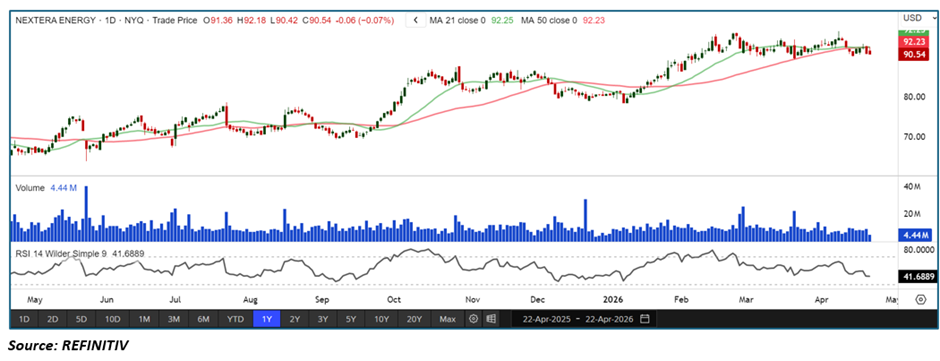
- NextEra Energy is trading around its 21-day (~$92.25) and 50-day (~$92.23) moving averages, indicating a loss of trend clarity
• Recent price action shows sideways movement with a slight downward bias
• Failure to make higher highs suggests trend exhaustion
• RSI near ~41 reflects weakening momentum and lack of strong buying pressure
• Volume remains moderate with no clear signs of accumulation
Trend Structure: Uptrend Losing Strength into Consolidation
NextEra Energy appears to be transitioning from a steady uptrend into a consolidation phase.
Key observations include:
• Prior uptrend has flattened out
• Price is no longer making consistent higher highs
• Structure shifting toward range-bound movement
This suggests the stock is entering a pause phase, with potential risk of breakdown if support fails.
Price Action: Sideways Drift with Mild Bearish Bias
Recent price behavior reflects fading bullish control:
- Repeated rejection near the $94–95 zone
• Lack of follow-through on upside attempts
• Gradual drift toward lower end of the range
This implies:
• Sellers are active near resistance
• Buyers lack conviction to push higher
• Price may be preparing for a directional move
oving Averages: Neutral to Slightly Bearish Setup
The moving average structure is weakening:
- Price is hovering around the 21-day MA (~$92.25)
• Price is near the 50-day MA (~$92.23)
• Averages are flattening, indicating trend slowdown
Interpretation:
• Short-term trend is neutral
• Medium-term trend is losing strength
• Breakdown below these levels could trigger bearish momentum
Momentum Indicators: RSI Reflects Weakening Strength
RSI is signaling declining momentum:
- RSI near ~41, below neutral 50
• No bullish divergence visible
• Momentum gradually trending lower
Interpretation:
• Selling pressure is increasing
• Momentum favors consolidation to downside
• Upside moves may remain limited
Volume Analysis: Lack of Strong Conviction
Volume trends remain subdued:
- No consistent spikes indicating aggressive buying
• Participation remains steady but unimpressive
• No clear accumulation phase visible
This indicates:
• Institutional activity is not strongly directional
• Market participants are cautious
• Breakout confirmation is missing
Market Structure: Consolidation with Breakdown Risk
The broader structure suggests a consolidation phase with emerging downside risk:
- Uptrend has stalled
• Range formation near recent highs
• Momentum weakening
This combination typically signals:
• Possible transition from accumulation to distribution
• Increased probability of breakdown if support fails
• Market waiting for a catalyst
ey Technical Levels & Scenarios
Support Levels
- ~$90–91 (immediate support zone)
• ~$88 (next demand zone)
• ~$85 (major support)
Resistance Levels
- ~$92.50 (21 & 50-day MA cluster)
• ~$94–95 (range high resistance)
• ~$97+ (breakout zone)
Scenarios
- Bearish Breakdown (Primary Case)
• Price breaks below $90–91 support
• RSI remains below 50
• Increased selling pressure
• Move toward $88–85 zones - Range Consolidation (Secondary Case)
• Price holds between $90–94
• RSI moves sideways between 40–50
• Low volatility environment
• Base formation before next trend - Bullish Continuation (Invalidation Scenario)
• Price breaks above $94–95 resistance
• Strong volume expansion
• RSI moves above 55–60
• Resumption of uptrend
Conclusion: Fading Momentum with Breakdown Risk
NextEra Energy is showing signs of weakening momentum, with price hovering around key moving averages and RSI indicating reduced strength. The inability to push higher and the shift toward sideways price action suggest a consolidation phase with downside risk.
Unless the stock decisively breaks above resistance with strong volume, the current structure leans toward continued range-bound movement or a potential breakdown in the near term.


 Please wait processing your request...