
Key Highlights
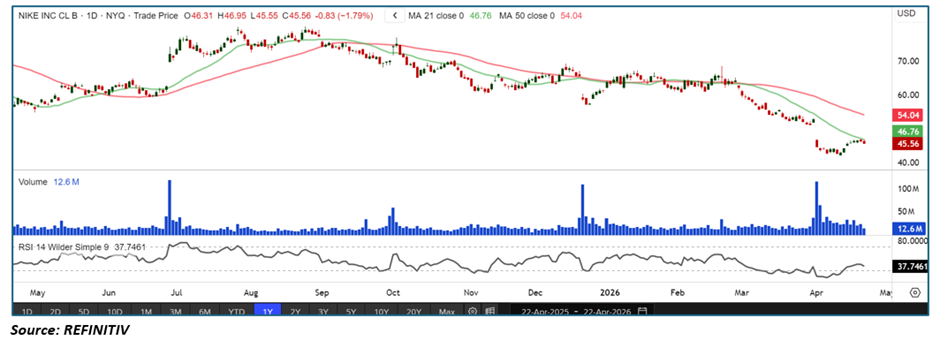
- Nike is trading below both the 21-day (~$46.76) and 50-day (~$54.04) moving averages, indicating a sustained bearish trend
• Price remains in a clear lower high–lower low structure
• Recent bounce attempt is weak and lacks follow-through
• RSI near ~37 reflects subdued momentum and weak buying interest
• Volume shows occasional spikes but no consistent accumulation
Trend Structure: Established Downtrend Remains Intact
Nike continues to trade within a well-defined downtrend.
Key observations include:
• Persistent formation of lower highs and lower lows
• Breakdown from prior consolidation zones
• No structural shift toward reversal yet
This suggests the stock remains in a bearish phase, with no clear signs of trend reversal.
rice Action: Weak Bounce After Sharp Decline
Recent price behavior reflects limited recovery strength:
- Sharp decline into the $44–45 zone followed by a mild bounce
• Bounce lacks momentum and conviction
• Price struggling to reclaim even short-term resistance
This implies:
• Sellers still dominate the broader trend
• Buyers are only active at lower levels, not aggressively
• Recovery attempts remain fragile
Moving Averages: Strong Bearish Alignment
The moving average setup reinforces the negative outlook:
- Price is below the 21-day MA (~$46.76)
• Price is well below the 50-day MA (~$54.04)
• Both averages are sloping downward
Interpretation:
• Short-term trend is bearish
• Medium-term trend is strongly negative
• Moving averages act as overhead resistance
Momentum Indicators: RSI Shows Weak Momentum
RSI is signaling subdued strength:
- RSI near ~37, below neutral 50
• No bullish divergence visible
• Momentum remains weak
Interpretation:
• Selling pressure still outweighs buying
• Momentum favors continuation or sideways drift
• Any upside may be limited
olume Analysis: No Clear Accumulation Trend
Volume trends are mixed:
- Occasional spikes during sell-offs
• No sustained increase in buying volume
• Lack of strong accumulation signals
This indicates:
• Institutional conviction is not clearly bullish
• Market participants remain cautious
• No confirmation of a bottoming process
Market Structure: Distribution Phase Within Downtrend
The broader structure suggests ongoing distribution:
- Breakdown from prior levels
• Weak bounce attempts
• Continued lower high formation
This combination typically signals:
• Continuation of bearish trend
• Supply outweighing demand
• Increased probability of further downside or prolonged consolidation
ey Technical Levels & Scenarios
Support Levels
- ~$44–45 (recent low zone)
• ~$42 (next demand zone)
• ~$40 (major psychological support)
Resistance Levels
- ~$46.70 (21-day MA — immediate resistance)
• ~$50 (intermediate resistance)
• ~$54 (50-day MA — major resistance)
Scenarios
- Bearish Continuation (Primary Case)
• Price remains below 21 & 50 MAs
• RSI stays below 50
• Lower highs continue
• Gradual move toward $42–40 - Consolidation / Base Formation (Secondary Case)
• Price stabilizes around $44–48
• RSI moves sideways between 35–45
• Reduced volatility
• Early base-building phase - Bullish Reversal (Invalidation Scenario)
• Price reclaims 21-day MA decisively
• Break above $50–54 resistance zone
• RSI moves above 50
• Structure shifts toward recovery
Conclusion: Downtrend Intact with Fragile Recovery Attempts
Nike remains in a clear bearish structure, with price trading below key moving averages and momentum indicators reflecting weak strength. The recent bounce lacks conviction and does not yet signal a reversal.
Unless the stock reclaims key resistance levels with strong volume, the prevailing trend remains downward, with a bias toward continued weakness or consolidation near lower levels.


 Please wait processing your request...