
Key Highlights
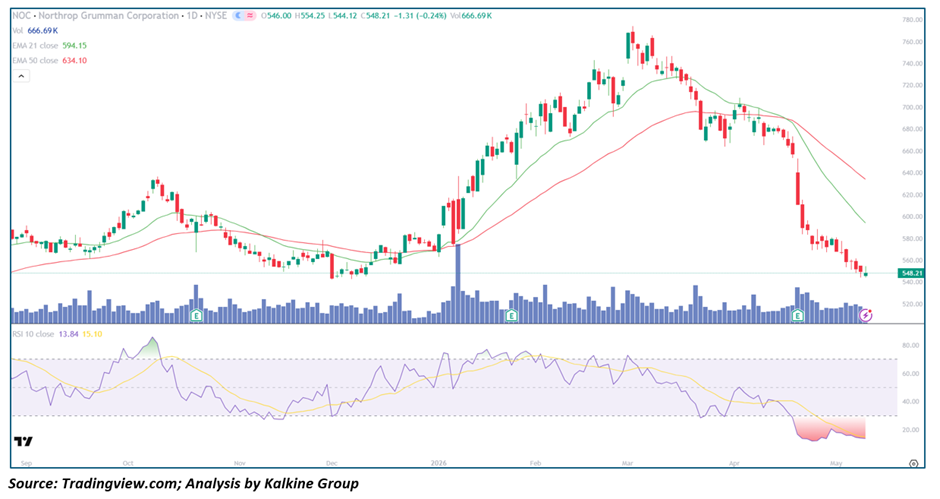
- Northrop Grumman (NYSE: NOC) is collapsing to $548.21 (-0.24%), now down a devastating ~$230 from its $770+ peak in February 2026 — a catastrophic ~30% destruction of Market Value in under three months
- Price is trading $45.94 below EMA-21 ($594.15) and $85.89 below EMA-50 ($634.10), with both MAs rolling over aggressively in a fully confirmed and deeply entrenched Death Cross alignment
- RSI-10 at an unprecedented 13.84 with smoothing average at 15.10 — the single most extreme oversold reading visible anywhere across the entire twelve-month chart, with both RSI and signal line in uncharted territory for this stock
- Volume at 666.69K remains persistently elevated relative to historical norms, with recent weeks showing a consistent pattern of above-average volume on down sessions confirming systematic institutional distribution
- Price is now testing the critical $544–$548 support zone — the last identifiable floor on the chart, dating back to the November 2025 lows — with a breach threatening to open a vacuum toward the $500–$520 area
Trend Structure: Total Structural Annihilation — Entire 2026 Bull Run Reversed and Then Some
NOC's technical narrative over the past twelve months represents one of the most dramatic reversals of fortune visible in the large-cap defense sector. The stock launched from the $540 area in late November 2025, embarking on a powerful and sustained bull run that carried it to extraordinary $770+ highs in February 2026 — a move of nearly 43% in under three months driven by defense sector tailwinds and strong institutional accumulation. The subsequent Reversal has been equally violent and far more sustained. The decisive break below EMA-50 in March 2026 was the first structural warning, and since then every attempted recovery has failed at progressively lower levels, printing a textbook sequence of lower highs and lower lows that leaves no ambiguity about the direction of the primary trend. Price has now retraced the entire November–February advance and is threatening to breach the very launch point of that rally — a development that would represent a complete and total negation of the bull case and signal potentially deeper structural damage.
Price Action: Vertical Collapse Testing the Last Known Support With No Buyers in Evidence
The price action in NOC since the March breakdown has been dominated by large, aggressive red candles with minimal recovery wicks — the signature of a market where sellers are fully in control and buyers are either absent or overwhelmed. The $580–$600 zone, which represented significant consolidation during December 2025, offered zero meaningful resistance and was breached in a single multi-session cascade. The current test of $544–$548 — the November 2025 swing low — is the final technical defense before the chart enters a zone with no prior reference points above $500. Today's session, while only modestly negative at -0.24%, shows an intraday range between $544.12 and $554.25 that is entirely contained within recent bearish structure, with no sign of the high-volume reversal candle that would be needed to signal even a temporary Capitulation floor. The weight of evidence suggests this support is fragile and at high risk of failing.
Moving Averages: Death Cross at Maximum Divergence — Recovery Requires Extraordinary Effort
The EMA configuration for NOC is as bearish as technically possible for a large-cap Equity. With price at $548.21 sitting $45.94 below EMA-21 ($594.15) and an extraordinary $85.89 below EMA-50 ($634.10), the magnitude of the divergence between price and both moving averages is historically severe. Both EMAs are pointing sharply lower with the gap between them still widening, confirming that the rate of decline continues to outpace even the falling averages — a sign that selling momentum is not decelerating. Reclaiming EMA-21 alone would require a +8.4% rally from current levels; reclaiming EMA-50 would Demand a +15.7% recovery — moves of extraordinary magnitude that have no foundation in the current technical structure and would require a fundamental catalyst of significant scale.
Momentum Indicators: RSI at 13.84 — Most Catastrophic Oversold Reading in Chart History
RSI-10 at 13.84 with its smoothing line at 15.10 represents a momentum condition of truly extraordinary severity — both the RSI and its signal line are at the lowest levels visible across the entire twelve-month chart, and the gap between them, while narrowing slightly, has not yet produced the bullish crossover that would serve as the minimum technical trigger for a bounce. The reading of 13.84 places NOC in a category of extreme oversold conditions rarely seen in large-cap defense names and suggests either a fundamental shock of significant magnitude or forced institutional Liquidation on a massive scale. Critically, while prior oversold episodes visible in October 2025 and December 2025 on this chart did produce sharp technical bounces, those occurred while the stock was in a structurally healthier environment with EMA support nearby. The current reading at 13.84 is unfolding in a fully broken, aggressively declining trend — a context in which even the most extreme oversold readings can persist or resolve only temporarily before resuming lower.
Volume Analysis: Persistent Distribution Pattern With No Accumulation Signal
Volume at 666.69K continues to run above historical averages, and the pattern over the past six to eight weeks tells an unambiguous story — the sessions with the largest volume readings are concentrated on down days, while attempted bounces occur on comparatively thin volume. The most significant volume spike in the entire chart — visible in the December 2025 period — occurred on a down day and marked the beginning of the accelerated decline phase. There are no high-volume bullish reversal candles, no hammer formations on elevated buying volume, and no evidence of institutional accumulation at these historically depressed levels. The persistent above-average volume on down sessions is consistent with systematic fund-level selling — whether from Earnings-driven fundamental re-ratings, sector rotation out of defense names, or Margin-related forced liquidation — all of which are signals that the selling is structural rather than emotional and unlikely to resolve quickly.
Key Technical Levels and Scenarios
Resistance Levels
- $554–$556 — Immediate overhead resistance (today's intraday high area)
- $594.15 — Critical resistance (EMA-21); major structural recovery hurdle
- $634.10 — Major resistance (EMA-50); full trend recovery target
Support Levels
- $544–$548 — Critical and immediate floor (current price / Nov 2025 lows)
- $518–$522 — Next visible support zone (pre-November 2025 consolidation base)
- $500–$505 — Extended psychological and technical target if $520 fails
Scenarios
- Bearish Continuation (Primary Case) — Death cross entrenched, RSI crossover absent, no accumulation signal present — price breaks below $544 and accelerates toward $520 and $500 as institutional distribution continues at scale.
- Extreme Oversold Bounce (Secondary Case) — RSI at historic extremes eventually triggers a violent technical snap-back toward $580–$594 EMA-21, which is aggressively sold — providing a potential short re-entry. Requires RSI bullish crossover above signal line (currently at 15.10) as minimum confirmation.
- Trend Stabilisation (Very Low Probability) — A massive high-volume bullish reversal candle followed by a sustained close above EMA-21 at $594 driven by a powerful fundamental catalyst could signal early bottoming — this scenario has no supporting evidence whatsoever in the current technical data.
Conclusion: Unprecedented Momentum Collapse With Zero Bottom Confirmation
Northrop Grumman is experiencing a technical breakdown of historic severity, with RSI-10 at 13.84 representing the most extreme oversold momentum reading visible on the entire chart while price collapses toward the critical $544 support zone that represents the last meaningful floor before a technical vacuum opens toward $500. The $85+ divergence between price and EMA-50, the fully confirmed death cross, the persistent above-average volume on down sessions, and the complete absence of any accumulation or reversal signal collectively confirm that bears are in absolute and unchallenged control of NOC. While the unprecedented RSI reading will inevitably trigger a mechanical technical bounce at some point — potentially violent in nature given the compression of selling energy — there is zero structural evidence that such a bounce will represent anything other than a temporary relief rally to be faded by sellers. The burden of proof rests entirely with the bulls, and until EMA-21 at $594.15 is reclaimed on strong, sustained volume, every rally in Northrop Grumman must be treated as a distribution opportunity.


 Please wait processing your request...