_04_23_2026_14_46_56_070548.jpg)
Key Highlights
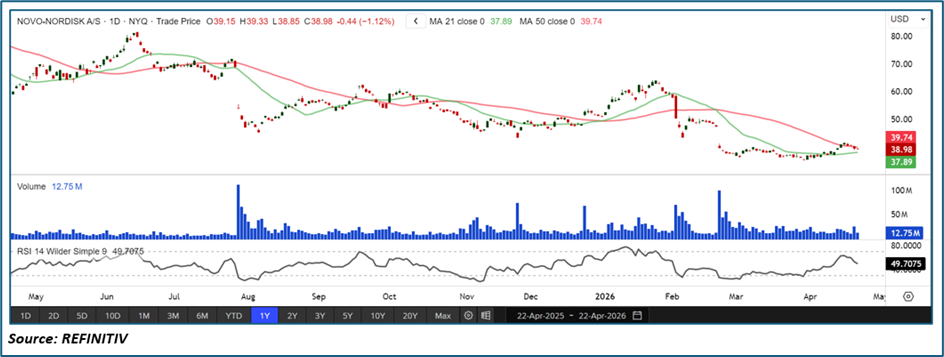
• NVO is trading between its 21-day (~$37.89) and 50-day (~$39.74) SMAs, reflecting a weak and uncertain structure
• Price remains below the 50-day MA, indicating overhead resistance
• RSI near ~49 signals neutral momentum with no strong buying pressure
• Recent price action shows a failed bounce and continuation of lower highs
• Weak 2026 outlook and rising competition are weighing on sentiment
Trend Structure: Downtrend with Base Formation Attempt
NVO remains in a broader bearish trend despite short-term stabilization.
Key observations include:
• Clear sequence of lower highs since early 2026
• Sharp breakdown followed by sideways consolidation
• No confirmed trend reversal yet
This suggests the stock is attempting to form a base but has not transitioned into a bullish structure.
Price Action: Weak Bounce with Lack of Follow-Through
Recent price behavior reflects hesitation:
• Small recovery from ~$36–37 zone
• Failure to reclaim the ~$40 resistance area
• Lower high formation after rebound
This implies:
• Sellers remain active on rallies
• Buyers lack conviction for a breakout
• Price may continue to move sideways to lower
oving Averages: Bearish-to-Neutral Alignment
The moving average structure shows mixed but weak signals:
• Price slightly above the 21-day SMA (~$37.89)
• Price still below the 50-day SMA (~$39.74)
• 50-day MA acting as dynamic resistance
Interpretation:
• Short-term stabilization attempt
• Medium-term trend still bearish
• A breakout above $40 is required for reversal confirmation
Momentum Indicators: RSI Reflects Lack of Direction
RSI is showing neutral conditions:
• RSI around ~49 (near 50 midpoint)
• No strong bullish divergence
• Momentum remains weak
Interpretation:
• Market indecision persists
• No clear directional strength
• Consolidation likely unless momentum expands
Volume Analysis: No Strong Accumulation Yet
Volume trends remain moderate:
• No sustained buying spikes
• Selling pressure previously dominant
• Recent activity lacks conviction
This indicates:
• Institutional accumulation not clearly visible
• Breakouts may struggle without volume support
Market Structure: Fundamental Pressure Limiting Upside
The broader setup reflects fundamental headwinds:
• Company guided for -5% to -13% sales growth in 2026, below expectations
• Increasing competition from rivals in obesity drugs, especially from Eli Lilly
• Pricing pressure and market share concerns impacting sentiment
At the same time, positives exist:
• New Wegovy approvals and pipeline developments offer long-term support
This combination leads to:
• Choppy price action
• Weak trend confidence
• Sensitivity to news flow
Key Technical Levels & Scenarios
Support Levels
• ~$37 (near-term base support)
• ~$35 (major support zone / recent lows)
Resistance Levels
• ~$40 (50-day MA — key resistance)
• ~$45 (previous breakdown zone)
Scenarios
- Range-Bound Consolidation (Primary Case)
• Price stays between $35–40
• RSI remains around 45–55
• Continued sideways movement - Bullish Reversal Attempt (Upside Case)
• Break above $40 with volume
• RSI moves above 60
• Move toward $45 resistance - Bearish Continuation (Risk Scenario)
• Breakdown below $35
• RSI falls below 40
• Downside extension toward new lows
Conclusion: Weak Structure with Resistance Overhead and Fundamental Pressure
Novo Nordisk is currently in a fragile technical setup, where price is attempting to stabilize but remains capped below key resistance. The broader downtrend is still intact, reinforced by weak guidance and competitive pressures in its core obesity drug segment.
Unless the stock decisively breaks above the 50-day moving average, the outlook remains neutral-to-bearish, with a higher probability of continued consolidation or downside drift rather than a strong recovery trend.


 Please wait processing your request...