
Key Highlights
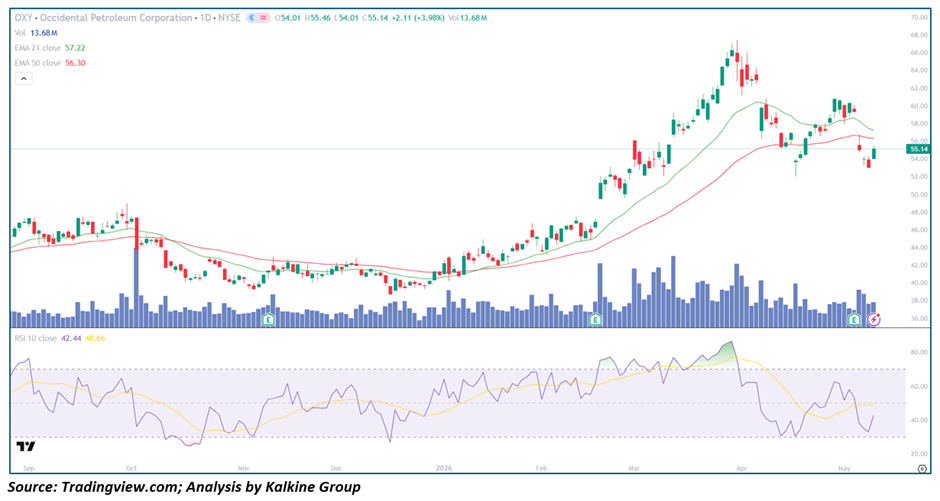
- Occidental Petroleum (NYSE: OXY) is recovering to $55.14 (+3.98%) following a sharp corrective pullback, but price remains $2.08 below EMA-21 ($57.22) and $1.16 below EMA-50 ($56.30) — still technically beneath both moving averages with reclamation the key near-term bull requirement
- The EMA structure is at a critical inflection point — EMA-21 ($57.22) has crossed below EMA-50 ($56.30) in a nascent Death Cross, but the extremely tight separation of just $0.92 between the two averages suggests the crossover is fresh, shallow, and potentially reversible with sustained buying pressure
- RSI-10 at 42.44 with smoothing average at 48.66 — RSI trading below its signal line in neutral-to-weak territory, but today's strong session has arrested the recent RSI decline and a bullish crossover above 48.66 would represent the first momentum confirmation that the corrective phase is ending
- Volume at 13.68M is meaningfully elevated and coincides with what appears to be an Earnings catalyst (E marker on today's session), providing fundamental ammunition for a potential trend Reversal that pure Technical Analysis alone could not sustain
- The broader twelve-month structure remains fundamentally bullish — OXY has advanced from $40 to $65 and back to $55, and the current correction represents a ~15% pullback from February highs within what may still be a longer-term uptrend
Trend Structure: Corrective Phase Testing Bull Trend Integrity — Critical Juncture
OXY's technical history over the past twelve months tells a compelling story of a deep base, a powerful bull run, and now a meaningful correction that is testing whether the primary uptrend remains intact. The stock spent September through December 2025 in a prolonged sideways-to-declining consolidation between $40 and $48, grinding through a period of directionless price action that gradually absorbed overhead Supply. The breakout above $48 in late December launched a powerful advance that carried price all the way to the $65 area by late February 2026 — a 35%+ move in under ten weeks driven by energy sector strength and clear institutional accumulation. Since the February peak, however, OXY has been in a corrective phase that has now retraced approximately 15% from the highs. The critical question technically is whether this correction is a healthy pullback within an ongoing bull trend — finding support at the $54–$56 zone and resuming higher — or the beginning of a more substantial structural reversal back toward the $44–$48 base. Today's +3.98% recovery on elevated earnings volume is the first meaningful evidence that the former scenario may be playing out.
Price Action: Earnings-Driven Bounce From Key Support — Reclaiming EMAs Is the Bull's First Task
Today's +3.98% surge from the $54 open to close at $55.14 is the most decisive single-session recovery since the correction began in late February, and its coincidence with an earnings event provides fundamental weight behind the technical move. The intraday range of $54.01 to $55.46 shows buyers stepping in aggressively from the open and maintaining control through the session — a constructive candle structure. However, the close at $55.14 still leaves price below both EMA-21 ($57.22) and EMA-50 ($56.30), meaning today's session, while encouraging, has not yet resolved the bearish EMA configuration. The immediate priority for bulls is a sustained daily close above EMA-50 at $56.30 — a level that is only $1.16 away — which would represent the first meaningful technical reclamation of structure since the correction accelerated in April. The prior support zone in the $55–$56 area, which provided a base during the January consolidation phase, now needs to flip back to support from the resistance role it has played over the past two weeks.
Moving Averages: Nascent Death Cross — Shallow and Reversible if Bulls Sustain Today's Momentum
The EMA picture for OXY sits at a genuine technical crossroads. EMA-21 at $57.22 has crossed below EMA-50 at $56.30 — technically a death cross — but the $0.92 gap between the two averages is the narrowest death cross formation visible on this chart, and both averages are flattening rather than pointing sharply lower. This stands in stark contrast to the deep, wide death cross configurations seen in stocks like MDT, NOC, or MCK where the price-to-EMA divergence is 10–30% and the averages are steeply declining. In OXY's case, the death cross is better characterized as an EMA compression event — the two averages have converged as price corrected through them — and a sustained recovery above $57.22 would produce a rapid bullish re-cross that would negate the bearish signal entirely. The $56.30–$57.22 EMA band is therefore the decisive zone: bulls need to reclaim it, bears need to defend it.
Momentum Indicators: RSI Attempting Recovery — Signal Crossover Would Confirm Momentum Shift
RSI-10 at 42.44 with its smoothing line at 48.66 places momentum in neutral-to-weak territory, but the configuration is more encouraging than the absolute reading suggests. The RSI reached deeply oversold levels near 30 in late April — the most extreme reading since the November 2025 lows — and has been recovering since, suggesting the worst of the selling momentum is behind the stock. Today's strong session has accelerated the RSI recovery, and a move above the signal line at 48.66 — requiring only a modest further continuation of today's buying — would generate the first bullish momentum crossover since the correction began and confirm that the RSI trough was a genuine oversold bottom rather than a brief pause before resuming lower. The RSI pattern in OXY is consistent with the setup seen at prior correction bottoms in November 2025 and January 2026, both of which resolved with sustained advances, adding confidence to the bullish recovery interpretation.
Volume Analysis: Earnings Volume Provides Credibility to the Bounce
Volume at 13.68M is substantially above the baseline daily volume seen throughout most of the uptrend and represents one of the larger single-session readings in recent months. Critically, it is occurring on a strong up day alongside an earnings event — the first time since the correction began that a large-volume session has coincided with meaningful upside price action. The volume pattern during the corrective phase from February to early May showed a concerning number of elevated-volume down sessions, suggesting distribution was occurring. Today's earnings-driven volume reversal — large volume on an up day — is the first sign that institutional buyers may be re-entering on the fundamental catalyst, potentially marking the end of the distribution phase. Confirmation would come from continued above-average volume on subsequent up days and a return to the pattern of above-average up-day volume that characterized the January–February bull phase.
Key Technical Levels and Scenarios
Support Levels
- $54.00–$54.50 — Immediate support (today's open / recent correction low)
- $52.00–$52.50 — Secondary support (April consolidation zone)
- $48.00–$49.00 — Major support (December 2025 breakout base; trend invalidation level)
Resistance Levels
- $56.30 — Critical near-term resistance (EMA-50; first reclamation target)
- $57.22 — Major resistance (EMA-21; full EMA reclamation target)
- $60.00–$61.00 — Intermediate resistance (March 2026 consolidation highs)
- $64.00–$65.00 — Major resistance (February 2026 peak highs)
Scenarios
- Bullish Reversal (Primary Case) — Earnings catalyst drives sustained buying, price reclaims EMA-50 at $56.30 and EMA-21 at $57.22 within the next few sessions, RSI crosses above signal line — correction is confirmed complete and advance toward $60–$65 resumes within the broader bull trend.
- Range-Bound Consolidation (Secondary Case) — Price recovers to the $56–$58 EMA zone but stalls, entering a multi-week consolidation that allows the EMAs to flatten and re-align before the next directional move — a neutral scenario that keeps both outcomes open.
- Bearish Continuation (Lower Probability) — Today's bounce fails to sustain above $56 on follow-through sessions, price reverses back below $54 on elevated volume — the death cross deepens and the correction extends toward the $48–$50 base, invalidating the bull case.
Conclusion: Constructive Recovery Attempt at a Critical Technical Juncture — Reclaim $56.30 to Confirm Bull Case
Occidental Petroleum is at one of the most technically significant inflection points of the past twelve months — a shallow and reversible death cross, an oversold RSI recovering from its deepest reading since November 2025, and today's earnings-driven +3.98% surge providing the first meaningful fundamental catalyst to challenge the corrective narrative. The broader context remains bullish — the stock has risen from $40 to $65 and corrected to $54, a healthy Retracement within a major uptrend — and the shallow nature of the EMA death cross ($0.92 separation) distinguishes OXY sharply from the deeply broken names where the structural damage is severe and sustained. The single most important near-term technical event is a sustained close above EMA-50 at $56.30 — achieved on continued volume — which would shift the balance of evidence decisively back toward the bulls and set up a recovery toward $60–$61 as the next meaningful target. Until that reclamation is confirmed, the situation remains an inflection point rather than a confirmed reversal.


 Please wait processing your request...