
Key Highlights
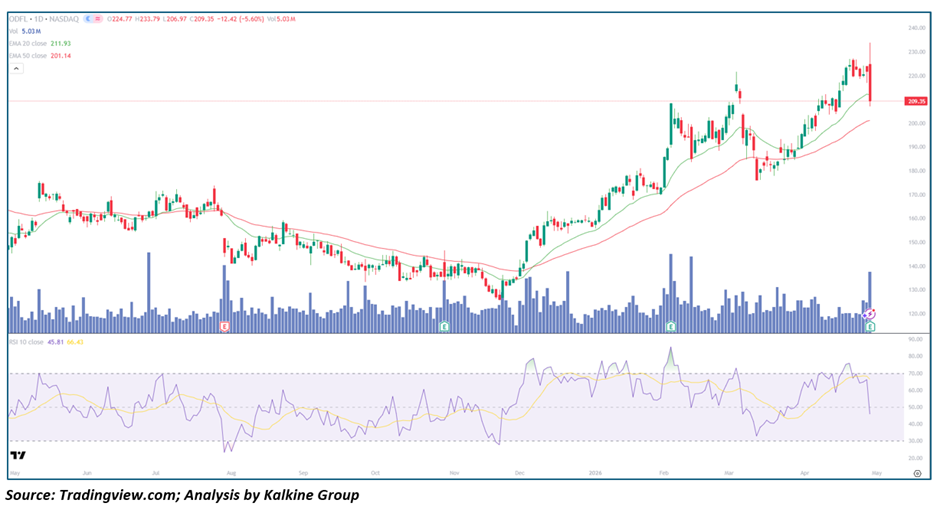
• Old Dominion Freight Line (Nasdaq: ODFL) is trading above its 50-day (~201.14) Moving Average but testing the 20-day (~211.93) after a sharp decline
• Price recently rallied strongly toward the 230–235 zone before facing rejection
• RSI has dropped toward the mid-40s, indicating cooling momentum
• Volume spiked during the recent decline, suggesting increased selling pressure
• Broader structure still reflects higher highs and higher lows despite pullback
Trend Structure: Bullish Trend with Short-Term Disruption
ODFL remains in an overall uptrend, though recent price action shows a pause.
Key observations include:
• Clear higher highs and higher lows over the past few months
• Strong impulsive rally followed by sharp rejection
• Break in short-term momentum but not in overall structure
This suggests:
• Medium-term trend remains bullish
• Short-term weakness is developing
• Pullback may be part of a broader continuation pattern
Price Action: Rejection from Highs with Increased Selling Pressure
Recent price behavior signals caution:
• Sharp bearish candle from recent highs
• Failure to sustain above 230 zone
• Increased Volatility near the top
This implies:
• Profit booking or distribution near highs
• Short-term sellers gaining control
• Potential continuation of pullback
Such action typically signals:
• Temporary exhaustion after strong rally
• Need for consolidation before next move
Moving Averages: Support Being Tested
The Moving Average structure is still constructive but under pressure:
• Price is near the 20-day MA (~212)
• Still holding above the 50-day MA (~201)
• Short-term average may act as immediate support
Interpretation:
• Short-term trend weakening
• Medium-term trend intact
• Key support test underway
Momentum Indicators: Cooling from Strength
RSI has declined significantly from prior highs.
Key signals:
• RSI near mid-40s shows loss of bullish momentum
• No longer overbought
• Indicates room for either rebound or further downside
Interpretation:
• Momentum reset in progress
• Neutral to slightly bearish short-term bias
• Potential base-building phase
Volume Analysis: Selling Pressure Visible
Volume trends highlight recent shift:
• Spike in Volume during price drop
• Higher activity on bearish candles
• Suggests active selling interest
This indicates:
• Distribution near highs
• Increased trader participation on downside
• Pullback has conviction
Market Structure: Bullish but Needs Stabilization
The broader setup remains positive but requires confirmation:
• Uptrend structure still valid
• Price correcting after extended move
• Momentum has weakened
This suggests:
• Bullish continuation possible after consolidation
• Risk of deeper pullback if support breaks
• Market needs to stabilize before next leg
Key Technical Levels and Scenarios
Support Levels
• 210–212 near 20-day Moving Average
• 200–202 near 50-day Moving Average
• 185–190 as deeper support zone
Resistance Levels
• 225–230 as immediate resistance
• 235 as recent high
• 250 as extended upside target
Scenarios
- Bullish Continuation (Primary Case)
• Price holds above 200
• Buyers step in near support
• Momentum stabilizes
• Move back toward 225–235 - Extended Pullback (Secondary Case)
• Break below 200
• Continued selling pressure
• Price moves toward 185–190
• Consolidation phase develops - Range Formation (Neutral Case)
• Price oscillates between 200 and 230
• Momentum remains neutral
• Base-building before next breakout
Conclusion: Uptrend Intact but Pullback in Progress
Old Dominion Freight Line remains in a broader bullish trend, but the recent sharp rejection and rising selling pressure indicate a short-term correction phase. While the structure still favors upside continuation, the stock may require consolidation or further downside testing before resuming its uptrend.


 Please wait processing your request...