
Key Highlights
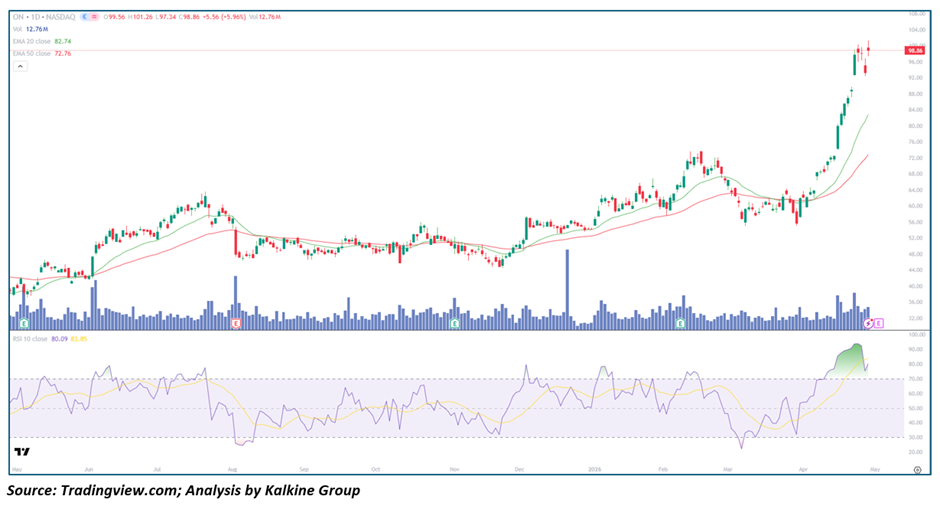
• ON Semiconductor (Nasdaq: ON) is trading significantly above its 20-day (~82.74) and 50-day (~72.76) moving averages, confirming a strong bullish trend
• Price has entered a near-vertical rally phase, pushing aggressively toward the 100 level
• RSI is above 80, indicating extremely overbought conditions
• Volume has expanded during the breakout, supporting strong participation
• Structure shows accelerating higher highs with minimal pullbacks
Trend Structure: Strong Uptrend Transitioning into Acceleration
ON Semiconductor is currently in a powerful bullish trend that has shifted into a breakout acceleration phase.
Key observations include:
• Consistent pattern of higher highs and higher lows
• Clear transition from gradual uptrend to sharp upward expansion
• Increasing steepness in price movement
This suggests:
• Buyers are firmly in control
• Momentum is expanding rapidly
• Trend strength is intensifying
The structure reflects a momentum-driven breakout with increasing extension risk.
Price Action: Explosive Breakout with Minimal Resistance
Recent price behavior highlights strong bullish dominance:
- Large bullish candles dominating recent sessions
• Breakout above prior resistance with strong follow-through
• Limited pullbacks during the rally phase
This implies:
• Strong buying pressure and momentum participation
• Weak resistance overhead
• Continuation likely but increasingly stretched
Such price action typically signals:
• Momentum-driven rally
• Potential continuation after short consolidation
Moving Averages: Bullish Alignment with Price Extension
The Moving Average structure confirms strength:
- Price is well above the 20-day MA (~82.7)
• Price is significantly above the 50-day MA (~72.7)
• Both averages are trending upward
Interpretation:
• Short-term trend is strongly bullish
• Medium-term structure supports continuation
• Moving averages act as dynamic support zones on pullbacks
Momentum Indicators: Extreme Overbought Signal
RSI is currently above 80, signaling very strong momentum.
Key signals:
• RSI well above 70 indicates overbought conditions
• Reflects aggressive buying activity
• High probability of short-term cooling
Interpretation:
• Momentum remains very strong
• Pullback or consolidation is increasingly likely
• Trend still bullish despite overextension
Volume Analysis: Breakout Supported by Participation
Volume trends support the breakout move:
- Noticeable Volume expansion during the rally
• Sustained participation through the uptrend
• No clear signs of distribution yet
This indicates:
• Strong conviction behind the move
• Institutional participation likely
• Rally is supported, not weak
Market Structure: Bullish with Elevated Extension Risk
The broader structure supports continued upside but with caution:
- Strong uptrend intact
• Price extended far above key averages
• Momentum extremely elevated
This combination suggests:
• Bullish continuation remains possible
• Elevated risk of sharp pullback
• Consolidation needed for sustainability
Key Technical Levels and Scenarios
Support Levels
• 95–98 as immediate breakout support
• 82–83 near the 20-day Moving Average
• 72–75 near the 50-day Moving Average
Resistance Levels
• 100 as psychological resistance
• 110 as next upside extension zone
• 120 as aggressive breakout target
Scenarios
- Bullish Continuation (Primary Case)
• Price holds above 95–98
• Momentum remains elevated
• Volume supports further upside
• Move toward 105–110 - Healthy Pullback (Secondary Case)
• RSI cools from overbought levels
• Price retraces toward 85–95
• Buyers step in near moving averages
• Uptrend resumes - Sharp Correction (Low Probability Scenario)
• Strong rejection near 100
• Selling pressure increases
• Price drops below 95
• Deeper pullback toward 75–85
Conclusion: Strong Breakout with Overextension Risk
ON Semiconductor is exhibiting a powerful breakout supported by strong momentum and Volume expansion. However, the stock is now in extremely overbought territory, increasing the likelihood of a near-term pullback or consolidation. While the broader trend remains firmly bullish, the current move appears stretched, and a cooling phase would help sustain the next leg higher.


 Please wait processing your request...