
Key Highlights
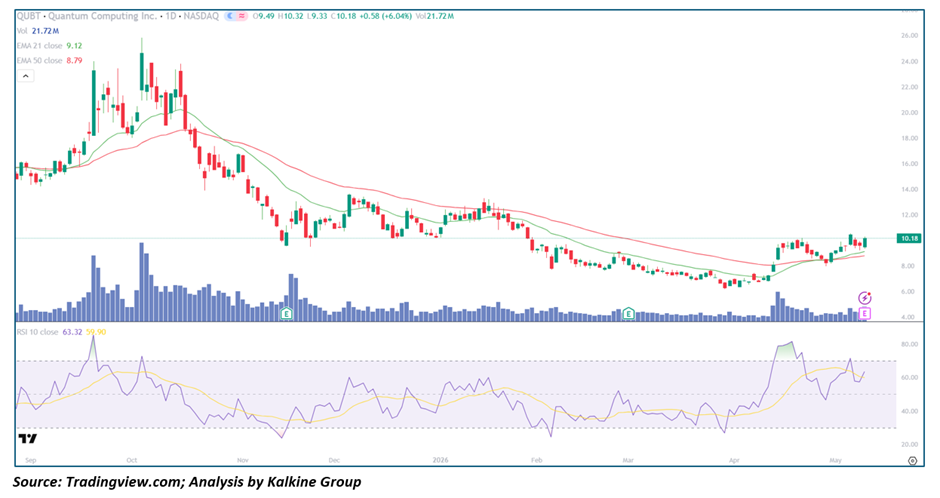
- Quantum Computing (Nasdaq: QUBT) is surging to $10.18 (+6.04%), building decisively on yesterday's breakout and now trading $1.06 above EMA-21 ($9.12) and $1.39 above EMA-50 ($8.79) — the first sustained close above both moving averages since the October 2025 peak
- The bullish EMA crossover is confirmed with EMA-21 ($9.12) now above EMA-50 ($8.79) and both averages curling upward — a textbook golden cross formation signaling a structural trend change from bear to bull
- RSI-10 at 63.32 with smoothing average at 59.90 — RSI trading above its signal line in bullish territory with ample room before overbought conditions, confirming momentum is firmly in buyers' favor
- Volume at 21.72M is among the most significant readings in months, with the recent surge in up-day volume providing powerful confirmation that institutional accumulation is actively underway
- Price has now broken above the critical $9.50–$10.00 resistance zone and is closing in on the next major resistance at $11.00–$12.00 — the December 2025 consolidation range
Trend Structure: Decisive Bear-to-Bull Transition — Base Breakout With Structural Confirmation
QUBT's technical evolution over the past twelve months is a classic bottoming and Reversal narrative. After an extraordinary parabolic run from $8 to $25+ between September and October 2025, the stock entered a prolonged and painful distribution phase that ground price all the way back to the $6.50–$7.00 area by February 2026 — erasing the vast majority of the speculative premium accumulated during the rally. However, the crucial development is what happened next: rather than continuing lower, QUBT spent February through April 2026 constructing a textbook accumulation base in the $6.50–$8.50 range, characterized by tightening price action, diminishing downside volume, and a gradual flattening of both EMAs. The March–April period saw EMA-21 begin curling upward and crossing above EMA-50 — the golden cross confirmation — and the subsequent price breakout above $10 on massive volume validates that the base was genuine accumulation rather than mere consolidation before another leg lower.
Price Action: Clean Breakout Above Multi-Month Resistance With Follow-Through Momentum
Today's +6.04% session to $10.18 is technically significant on multiple levels. First, it represents a sustained close above the $10.00 psychological resistance level — a level that capped multiple rally attempts during the December 2025 consolidation phase. Second, the intraday structure shows a healthy range between $9.33 and $10.32 with a strong close near the highs, indicating that buyers are maintaining control through the session rather than fading into strength. Third, this is the second consecutive day of decisive upside momentum following what appears to be an Earnings-driven catalyst (visible from the E marker on the volume panel), suggesting that a fundamental re-rating may be accompanying the technical breakout. The price action since early March shows a clear and consistent pattern of higher lows and now higher highs — the structural definition of an emerging uptrend.
Moving Averages: Golden Cross Confirmed — Both EMAs Now Acting as Dynamic Support
The EMA picture for QUBT has undergone a complete structural transformation. EMA-21 at $9.12 has crossed above EMA-50 at $8.79, confirming the golden cross, and critically, both averages are now pointing upward — a configuration that contrasts sharply with the Death Cross alignment that dominated the November 2025 through February 2026 period. Price at $10.18 is trading above both EMAs, which are now acting as rising dynamic support rather than overhead resistance. The $8.79–$9.12 zone defined by the two EMAs represents a significant support band that, if tested on any pullback, should attract buyers. The EMA structure is now unambiguously constructive and provides a technical framework for building long positions on dips.
Momentum Indicators: RSI in Bullish Zone With Signal Crossover Intact and Room to Run
RSI-10 at 63.32 with its smoothing line at 59.90 places QUBT in a firmly bullish momentum configuration — RSI above its signal line, both trending upward, and positioned well below the 80 overbought threshold that would signal caution. The current reading mirrors the RSI configuration that preceded the powerful October 2025 rally, when a similar above-signal RSI setup in the 60–65 range led to a sustained multi-week advance. Importantly, the RSI has recovered from the deeply oversold readings of December 2025 and February 2026 through a gradual, sustained process rather than a single spike — a pattern that historically suggests the momentum recovery is durable rather than a one-session event. There is significant RSI headroom between 63 and 80, providing room for continued price appreciation before momentum conditions become stretched.
Volume Analysis: Institutional Accumulation Confirmed — Largest Up-Day Volume in Months
Volume at 21.72M is the largest single-session reading in several months and, critically, it is occurring on a strong up day — the direct inverse of the distribution pattern that characterized the decline phase. Looking at the broader volume pattern since the February lows, there is a clear and encouraging shift: volume on up days has been consistently exceeding volume on down days, and the recent cluster of above-average volume sessions coinciding with price advances is the classic signature of institutional accumulation. The earnings event marker visible on today's session suggests that positive fundamental news may be serving as the catalyst that is bringing institutional buyers off the sidelines, converting what was a technical base into a fundamentally supported trend reversal.
Key Technical Levels and Scenarios
Support Levels
- $9.50–$9.75 — Immediate support (breakout retest zone)
- $9.12 — Critical support (EMA-21); golden cross anchor
- $8.79 — Major support (EMA-50); trend invalidation level on close below
Resistance Levels
- $11.00–$11.50 — Near-term resistance (December 2025 consolidation lows)
- $13.00–$13.50 — Intermediate resistance (December 2025 range highs)
- $18.00–$20.00 — Extended bullish target (pre-parabolic base area)
Scenarios
- Bullish Continuation (Primary Case) — Golden cross confirmed, RSI above signal, institutional volume surging — price consolidates briefly above $10 before advancing toward $11.50 and $13 as momentum attracts fresh buying interest.
- Healthy Pullback and Retest (Secondary Case) — Price pulls back to retest the $9.50–$9.75 breakout zone on reduced volume, finds support, and resumes higher — a constructive development that would offer an improved risk/reward entry for buyers who missed the initial move.
- Breakout Failure (Low Probability) — A daily close back below EMA-50 at $8.79 on elevated volume would negate the golden cross and signal the breakout was a false move — this scenario requires close monitoring but is not supported by the current weight of evidence.
Conclusion: Textbook Base Breakout With Full Technical Confirmation — Bulls Back in Control
Quantum Computing Inc. is presenting one of the most technically complete bullish reversal setups visible in the current market — a prolonged accumulation base, a confirmed golden cross, a price breakout above multi-month resistance on the heaviest volume in months, and RSI momentum firmly in bullish territory with room to extend. The structural shift from the death cross bear phase that dominated late 2025 and early 2026 to the current golden cross bull configuration represents a genuine change in trend character, validated by both price action and volume. With EMA-21 and EMA-50 now acting as rising dynamic support in the $8.79–$9.12 zone, the technical framework favors buying dips and targeting the $11.50–$13.00 resistance band as the near-term objective, with a broader recovery toward $18–$20 possible if the fundamental re-rating narrative gains traction.


 Please wait processing your request...