
Key Highlights
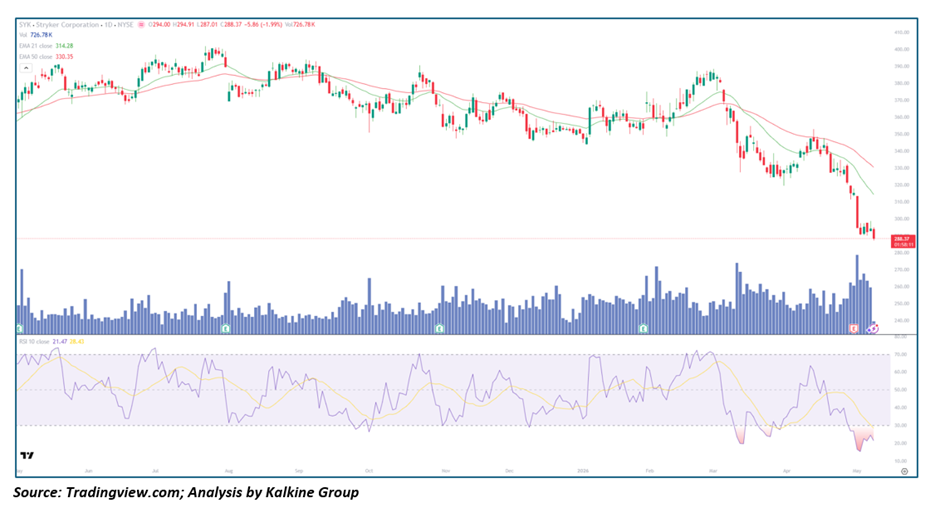
- Stryker (NYSE: SYK) is crashing to $288.37 (-1.99%), now down a staggering ~$115 from its $400+ peak — a 28%+ destruction of Market Value in under twelve months
- Price is trading a massive $26 below EMA-21 ($314.28) and $42 below EMA-50 ($330.35), with both MAs sloping aggressively lower in a confirmed Death Cross alignment
- RSI-10 at 21.47 with smoothing average at 28.43 — deeply in oversold territory with a red shaded zone indicating the most extreme selling episode in the entire chart's history
- Volume at 726.78K is elevated and among the highest readings in recent months, confirming active institutional distribution rather than retail Capitulation
- Structure has completely broken down with price making fresh multi-year lows — no support floor visible on the current timeframe
Trend Structure: Complete Structural Breakdown — Bear Phase Fully Entrenched
SYK has transitioned from a broadly sideways-to-weak structure throughout mid-2025 into a full-blown bear phase with accelerating momentum to the downside. The stock spent much of 2025 oscillating between $360 and $400 without establishing a clear directional trend, but the decisive break below the critical $350 support level in late 2025 triggered a cascade of selling that has not abated. Since January 2026, the decline has been relentless — each attempted recovery finding aggressive sellers, with every lower high confirming that distribution is ongoing and systemic. Price is now printing levels not seen since 2023, erasing years of gains in a matter of months, and there is no visible base formation or accumulation pattern that would suggest the selling is near completion.
Price Action: Waterfall Acceleration With No Support in Sight
The most alarming aspect of SYK's current price action is the acceleration of the decline in recent weeks — rather than slowing as it approaches historically significant levels, the selling has intensified, with large red candles dominating the tape and today's -1.99% session adding to an already brutal drawdown. The $290–$300 zone, which represented a significant consolidation area in 2023, has now been decisively violated, removing what was the last meaningful technical support on the chart. With no visible horizontal support below current levels on this timeframe, the decline has a technical vacuum beneath it. Any attempt at a bounce is likely to be met with aggressive selling from trapped longs who bought at higher levels and are looking for any opportunity to reduce exposure.
Moving Averages: Death Cross Fully Confirmed — Both EMAs Acting as Resistance
The EMA picture for SYK is unequivocally bearish. Price at $288.37 sits $25.91 below EMA-21 ($314.28) and $41.98 below EMA-50 ($330.35) — both averages are pointing sharply downward with the gap between price and the EMAs actually widening, suggesting the rate of decline is outpacing even the falling moving averages. The EMA-21 crossed below EMA-50 months ago confirming the death cross, and both are now acting as formidable overhead resistance zones. For context, reclaiming EMA-21 alone would require a +9% rally from current levels — a significant move that would require extraordinary buying conviction and a fundamental catalyst, neither of which is currently in evidence.
Momentum Indicators: Most Extreme Oversold Reading in Chart History
RSI-10 at 21.47 with its smoothing line at 28.43 — the red shaded area on the RSI panel — represents the most severe oversold reading visible across the entire twelve-month chart, surpassing even the previous capitulation episodes in July 2025 and November 2025. While prior instances of RSI reaching these levels did produce sharp technical bounces, those bounces occurred within a broader trading range structure where the trend was not firmly directional. The current extreme oversold reading is occurring within an established and accelerating downtrend — a critically important distinction. The RSI smoothing line at 28.43 remains above the RSI at 21.47, suggesting the momentum signal has not yet generated a bullish crossover, meaning even the short-term technical bounce trigger has not fired.
Volume Analysis: Distribution Pattern at Its Most Aggressive
Volume at 726.78K is among the highest single-session readings in the twelve-month period, and the pattern is deeply concerning — the two largest volume spikes in the entire chart have both occurred on the downside in recent weeks, confirming that institutional players are actively and aggressively distributing shares at current levels. There are no visible high-volume accumulation days, no hammer candles on elevated volume, and no signs of the Buy-Side absorbing Supply. The volume profile is consistent with forced selling — whether from margin calls, fund redemptions, or fundamental-driven institutional exits — all of which are bearish signals that suggest the selling is systematic rather than emotional, making a swift Reversal less likely.
Key Technical Levels and Scenarios
Resistance Levels
- $294.00–$295.00 — Immediate overhead resistance (today's open level)
- $314.28 — Critical resistance (EMA-21); major hurdle for any recovery
- $330.35 — Major resistance (EMA-50); full structural recovery target
Support Levels
- $285.00–$287.00 — Immediate floor (current price area)
- $275.00–$278.00 — Next visible support zone
- $265.00 — Extended downside target if $280 fails
Scenarios
- Bearish Continuation (Primary Case) — No accumulation evidence, death cross intact, and RSI yet to cross above signal line — price breaks $285 and accelerates toward $275 and $265 as distribution continues.
- Extreme Oversold Bounce (Secondary Case) — RSI at historic lows triggers a sharp but shallow technical bounce toward $300–$314 EMA-21, which is aggressively sold — providing a potential short re-entry. Requires RSI crossover confirmation first.
- Trend Stabilisation (Very Low Probability) — A high-volume bullish reversal candle followed by a sustained close above EMA-21 at $314 with a fundamental positive catalyst could signal early bottoming — this scenario requires evidence not yet present in the data.
Conclusion: Capitulation-Level Selling With No Bottom Signal Confirmed
Stryker Corporation is experiencing one of the most severe and sustained technical breakdowns in its recent history, with today's decline to $288.37 printing the most extreme oversold RSI reading visible on the chart while volume surges confirm active institutional distribution. The death cross EMA alignment, accelerating price deterioration, complete absence of accumulation, and breach of all meaningful support levels collectively paint a picture where the bears are firmly and completely in control. While the extreme RSI reading will inevitably produce a technical bounce at some point, there is zero structural evidence that this bounce will be anything more than a relief rally to be faded. The burden of proof remains entirely with the bulls, and until EMA-21 at $314 is reclaimed on strong volume, every rally should be treated as a shorting opportunity.


 Please wait processing your request...