
Executive Summary
Celestica Inc. (NYSE: CLS) has reached a pivotal technical inflection point, successfully breaching a long-term falling channel that has constrained price action for several months. This breakout represents more than just a momentary price spike; it signals a fundamental structural shift from a corrective consolidation phase to a renewed bullish expansion. Supported by robust trading volume, favorable moving average alignments, and burgeoning exposure to AI infrastructure, the technical outlook for CLS suggests a high-probability continuation of its primary uptrend.
Technical Highlights
- Structural Trend Reversal: Celestica Inc. (NASDAQ: CLS) definitively cleared the upper resistance boundary of a long-term falling channel.
- Momentum Confluence: Price is trading well above the 21-period and 50-period Simple Moving Averages (SMAs).
- RSI Strength: The 14-period Relative Strength Index (RSI) maintains a positive trajectory above the 50 level.
- Institutional Confirmation: Breakout is accompanied by increased volume, suggesting strong market participation.
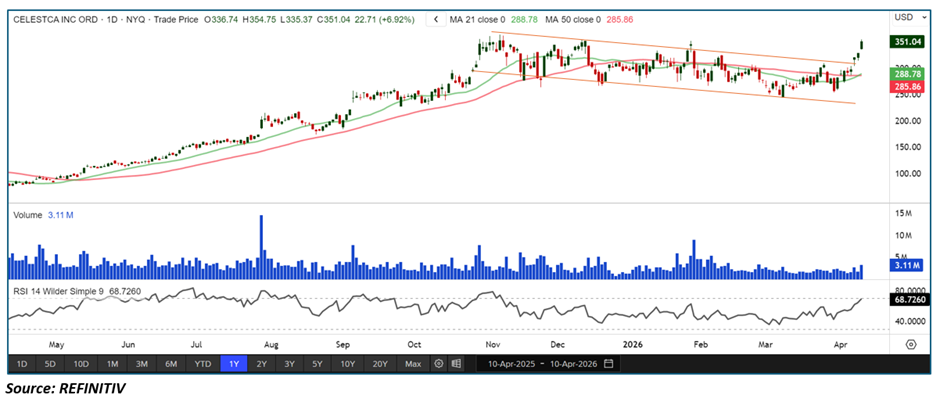
Trend Structure: From Correction to Expansion
For much of the recent quarter, Celestica’s price action was characterized by a classic "falling channel"—a series of lower highs and lower lows. This phase is typically viewed as a "digestive" period where the market absorbs previous gains before seeking a new catalyst.
The recent move above the channel’s upper descending trendline is a critical development. In technical terms, this invalidates the bearish structure and marks the emergence of a "higher high" sequence. This transition usually signals that the supply-demand imbalance has shifted back in favor of the bulls, ending the corrective phase and initiating a sustained trend expansion.
Price Action and Volume Analysis: The Quality of the Breakout
Not all breakouts are created equal. The current move in CLS is characterized by impulsive price action, marked by wide-bodied green candles and minimal "wicks" at the top, showing that buyers are aggressive and closing near the highs of the session.
Crucially, volume analysis confirms this move. A breakout on thin volume is often a "bull trap," but CLS has seen a notable uptick in participation. This reflects institutional accumulation as market participants re-rate the stock based on its strong earnings trajectory and its strategic positioning within the AI and cloud computing supply chains.
Moving Average Alignment: Defining the Support Floor
The moving average (MA) ribbon provides a clear visual of the stock’s current strength.
- The 21-Period SMA: Acts as the "fast" support level. As long as price remains above this line, the short-term momentum is considered aggressive and intact.
- The 50-Period SMA: Serves as the medium-term structural floor. The fact that the 21-period SMA is trending above the 50-period SMA creates a "bullish stack," providing multiple layers of dynamic support for any potential pullbacks.
These averages now serve as psychological markers for traders. Any retracement toward these levels is likely to be viewed by sidelined investors as a "buy-the-dip" opportunity rather than a signal of weakness.
RSI and Momentum Oscillators
The 14-period Relative Strength Index (RSI) is currently hovering in the 60–65 range. This is the "sweet spot" for trend followers:
- Bullish Bias: It remains firmly above the 50 midline, confirming that buying pressure outweighs selling pressure.
- Room for Growth: Because it has not yet exceeded the 70 level (the traditional "overbought" threshold), the stock has significant room to run before it reaches a state of technical exhaustion.
Key Technical Levels and Price Targets
As Celestica enters this new phase of price discovery, the following levels are paramount:
|
Level Type |
Price Zone / Indicator |
Significance |
|
Immediate Resistance |
Recent Swing Highs |
The first hurdle for a continued rally. |
|
Upside Target |
Prior All-Time Highs |
The primary objective for the current expansion phase. |
|
Immediate Support |
21-period SMA |
The first line of defense for short-term bulls. |
|
Primary Support |
Falling Channel Trendline |
Former resistance now acting as a floor. |
Strategic Scenarios and Risk Management
Scenario 1: Direct Continuation (Primary)
The stock consolidates briefly above the breakout point before making a run for prior highs. This scenario is supported by the current RSI trajectory and volume profiles.
Scenario 2: The "Throwback" Retest (Secondary)
Price retraces to "re-test" the upper boundary of the falling channel or the 50-day SMA. This is a common occurrence in healthy trends, allowing the market to confirm the new support level before moving higher.
Scenario 3: Breakout Failure (Risk)
While low probability, a close back inside the falling channel would suggest a "false breakout." Investors should monitor for any sudden drop in RSI below 50 or a breakdown of the 50-period SMA as a signal to tighten stop-losses.
Conclusion: A High-Conviction Technical Setup
The technical outlook for Celestica Inc. is overwhelmingly positive. By clearing its long-term descending resistance, the stock has neutralized the bearish pressure that dominated its recent consolidation. With the wind of AI infrastructure growth at its back and a clean technical chart ahead, CLS is well-positioned for continued outperformance. Investors should focus on the 21-period SMA as the barometer for short-term strength while eyeing a return to previous highs as the breakout matures.


 Please wait processing your request...